Introduction
Scientific Molding Guide
Materials, Design, Process Optimization, Troubleshooting, and Other Practical Information from the Experts at Routsis Training
Plastics is a sophisticated and diverse discipline. To excel, you need a good grasp of a wide range of concepts and data.
That’s what this reference guide is all about. Designed as both a starting point for entry-level personnel and a refresher reference for experienced professionals, this guide is packed with practical information built on Routsis’s 30-plus years of plastics training and consulting success.
- The science of plastics processing
- Materials and properties
- Part and mold design basics
- Process optimization
- Scientific troubleshooting
While we hope you find this information useful, it should not be considered a substitute for continuous training. Techniques and technologies are advancing rapidly throughout the industry, which is why top-performing professionals turn to Routsis to keep enhancing their skills.
We invite you to further explore the topics covered in this guide through the comprehensive array of online training programs we provide at www.traininteractive.com.
Disclaimer
This reference guide contains general recommendations intended solely for informational use within the plastics injection molding industry. It is not intended to serve as engineering advice.
The information contained herein is based on published information, knowledge, research, and experience which are presumed to be accurate and complete to the best of our ability.
All information is based on averaged data of commonly available grades of plastics and current industry practices at the time of this printing. Therefore it is the user’s responsibility to review and confirm all design, calculations and processing decisions.
You should always design and process using the recommendations that are provided by your raw material supplier, resin distributer, machine and equipment supplier(s).
Each material, machine, and process has its own set of influencing factors and therefore may, or may not; comply with the information provided in this guide.
Routsis Training, LLC will not accept responsibility or liability for use of the information contained within this guide.
Contact Us
Routsis Training
379 Amherst Street PMB 233
Nashua, NH 03063 (USA)
phone:(978) 957-0700
website:www.traininteractive.com
store:store.traininteractive.com
email: info@traininteractive.com
Understanding Plastics
General Classification of Polymers
In the industry, plastics are often referred to as polymers, and the actual plastic pellets are commonly referred to as resin or raw material. A polymer is classified using different criteria and is considered to be either; natural or synthetic, thermoset or thermoplastic, and amorphous or semi-crystalline. Natural polymers are those found in nature, such as rubber, cotton, and silk. Injection molding calls for the use of man-made synthetic polymers such as polyethylene, ABS, and nylon.
Thermoplastics vs. Thermosets
Polymers get their strength from a process called polymerization. During polymerization, small molecules called monomers combine to form long polymer chains. Thermosets are polymerized during processing while thermoplastics are polymerized before being processed. During processing, the polymer chains in thermosets fuse together, or cross-link. Once these polymers cross-link, they undergo a chemical change which prevents them from being melted and reprocessed. An egg is an example of a natural polymer which thermosets. Once the egg is heated, it solidifies and cannot be melted again.
Thermoplastics are long polymer chains that are fully polymerized when shipped by the resin manufacturer. Thermoplastics can be re-ground, melted and re-processed while retaining most of their original properties. An example of a natural thermoplastic material is wax. It can be melted and formed. Once cooled, the hardened wax can be melted and formed again. Unlike thermosets, most plastics companies prefer thermoplastic materials because they can be reprocessed and recycled.
Amorphous vs. Semi-Crystalline
Thermoplastic polymers can be categorized into two types; amorphous and semi-crystalline. Amorphous polymers melt gradually when heated. During cooling, amorphous polymer chains solidify slowly in a random orientation. By the end of the cooling phase, they shrink about one half of a percent. Common amorphous polymers include ABS, polystyrene, polycarbonate, and PVC.
Semi-crystalline polymers melt quickly, once heated to their melting temperature. The rapidly melting polymer is easy to process compared to amorphous polymers. As a semi-crystalline material cools, portions of the polymer chains remain in a random state – while portions orient into compact structures called crystalline sites. These crystalline sites increase the strength and rigidity of the polymer. During cooling, semi-crystalline polymers shrink up to three percent – much more than amorphous polymers. Semi-crystalline polymers include nylon, polyester, polyethylene, and polypropylene.
Hygroscopic vs. Non-Hygroscopic
Thermoplastic polymers processed in the plastics industry are either hygroscopic; meaning they absorb moisture from the air, or non-hygroscopic; meaning they do not tend to absorb moisture from the air. Many low-cost commodity polymers, such as polypropylene, polyethylene, and polystyrene are non-hygroscopic polymers, which do not absorb moisture from the air. Any non-hygroscopic polymer can still get wet when exposed to water, or attract surface moisture in high humidity environments – such as outdoor silos, storage tanks, and overseas shipping containers.
Most engineering and specialty resins such as nylon, acetal, and polycarbonate are hygroscopic polymers, which absorb moisture from the air. These polymers have a natural attraction between the resin and water molecules. This creates a chemical bond, causing the polymer to retain water when it is exposed to moisture. In most cases, hygroscopic polymers require air which is both heated and dried to ensure proper material drying. This air must have the moisture removed through a dehumidifying process, such as desiccant or vacuum dryers.
Too much moisture in a hygroscopic polymer will interfere with the molding process due to hydrolysis. Hydrolysis is the breakdown of a water molecule when heated. Once broken down into hydrogen and oxygen, these molecules will chemically react with the polymer chains, causing them to break. Visual defects such as splay, poor surface finish, bubbles, or delamination can occur as a result of moisture in hygroscopic polymers. Hydrolysis can also cause a significant change in the physical properties of the polymer including: reduced strength, increased brittleness, dimensional stability, poor heat resistance, and tendency to warp.
Understanding Variability in Plastics Processing
The development of a robust injection molding process is highly dependent on the injection molder’s ability to cope with variability.
Variability can be introduced by many aspects of the process, including: the material, the mold, the machine, the operator, and the process.
A material can vary greatly from grade to grade and lot to lot. Changes in additives, colorants, molecular weight, molecular weight distribution, moisture level, and percentage of regrind can result in a variation in the ability to process a given material. Aspects such as ambient conditions, hydraulic fluid quality, equipment wear, and water supply can all result in variation in the molding process. Many steps such as material qualification, preventative maintenance, and scientific molding are used to minimize the influence of this variation on the quality of the final molding product. The goal of a good molder is to develop a system and process which is best able to compensate the variation which is always going to occur.
Understanding Viscosity
The viscosity of the polymer is a measure of the material’s resistance to flow. A material which flows easily has a low viscosity, while a material with a higher viscosity does not flow as easily. Most polymers are available in different grades; each grade having its own flow characteristics. Typically, materials with lower viscosity have lower molecular weight. These materials are easier to process, but typically have lower mechanical strength than the same polymer with a higher viscosity.
The viscosity of the polymer can be used to compare the flow characteristics of different polymers, or different grades of the same polymer. Viscosity data can also be used to qualify a new material or compare a newer lot of material to a previously used batch of material.
Rheology, as defined by Merriam Webster, is ‘a science dealing with the deformation and flow of matter’. A polymer’s resistance to flow is known as its viscosity, and the rate at which the polymer flows is referred to as its shear rate.
Capillary Rheometry
The capillary rheometer melts the polymer inside a small barrel, and then a plunger forces the polymer melt through a small capillary. The rheometer measures the amount of force required to push the polymer through the capillary. The shear stress on the melt equals the force divided by the surface area of the plunger. The shear rate is a measure of how fast the material is being tested.
The shear rate is determined by the rate of flow through the capillary, and the die geometry. The viscosity of the material is equal to the shear stress divided by the shear rate. In capillary rheometry, the viscosity is usually determined at different temperatures and shear rates.
When the viscosity data is graphed, it provides a good representation of how the material behaves during processing. If capillary rheometry data can be obtained, it is a good method of comparing the flow characteristics of different resins. Always compare capillary rheometer data from similar shear rates and temperatures.
Melt Flow Index
Melt flow indexing is the most popular, and yet least accurate way to determine material viscosity. This method uses a standard testing apparatus with a standard capillary to measure the flow of the material. The melt flow indexer tests the polymeric material at a single shear stress and melt temperature. The melt flow index is the measure of how many grams of polymer pass through the capillary over 10 minutes.
A higher melt flow index indicates a lower material viscosity. This means that a material with a melt flow index of 20 flows easier than a material with a melt flow index of 5. The value obtained through the melt flow index test is a single data point. Melt flow index information from different materials and material grades may be used for a rough comparison of flow characteristics for different materials. The melt flow index value is given for each material by virtually all material suppliers.
Spiral Flow Test
The spiral flow test uses a mold with a long spiral flow channel emanating from the center. Notches are etched along the flow path to help identify the length the polymer has flowed within the mold. The mold can be filled using either a constant velocity (constant shear) or constant pressure (constant strain) to determine the polymer behavior.
The behavior of the polymer can be evaluated based on process output data such as flow length, part weight, and pressure at transfer. When using the spiral flow test, it is best to use a mold which has a channel thickness similar to the parts actually being molded.
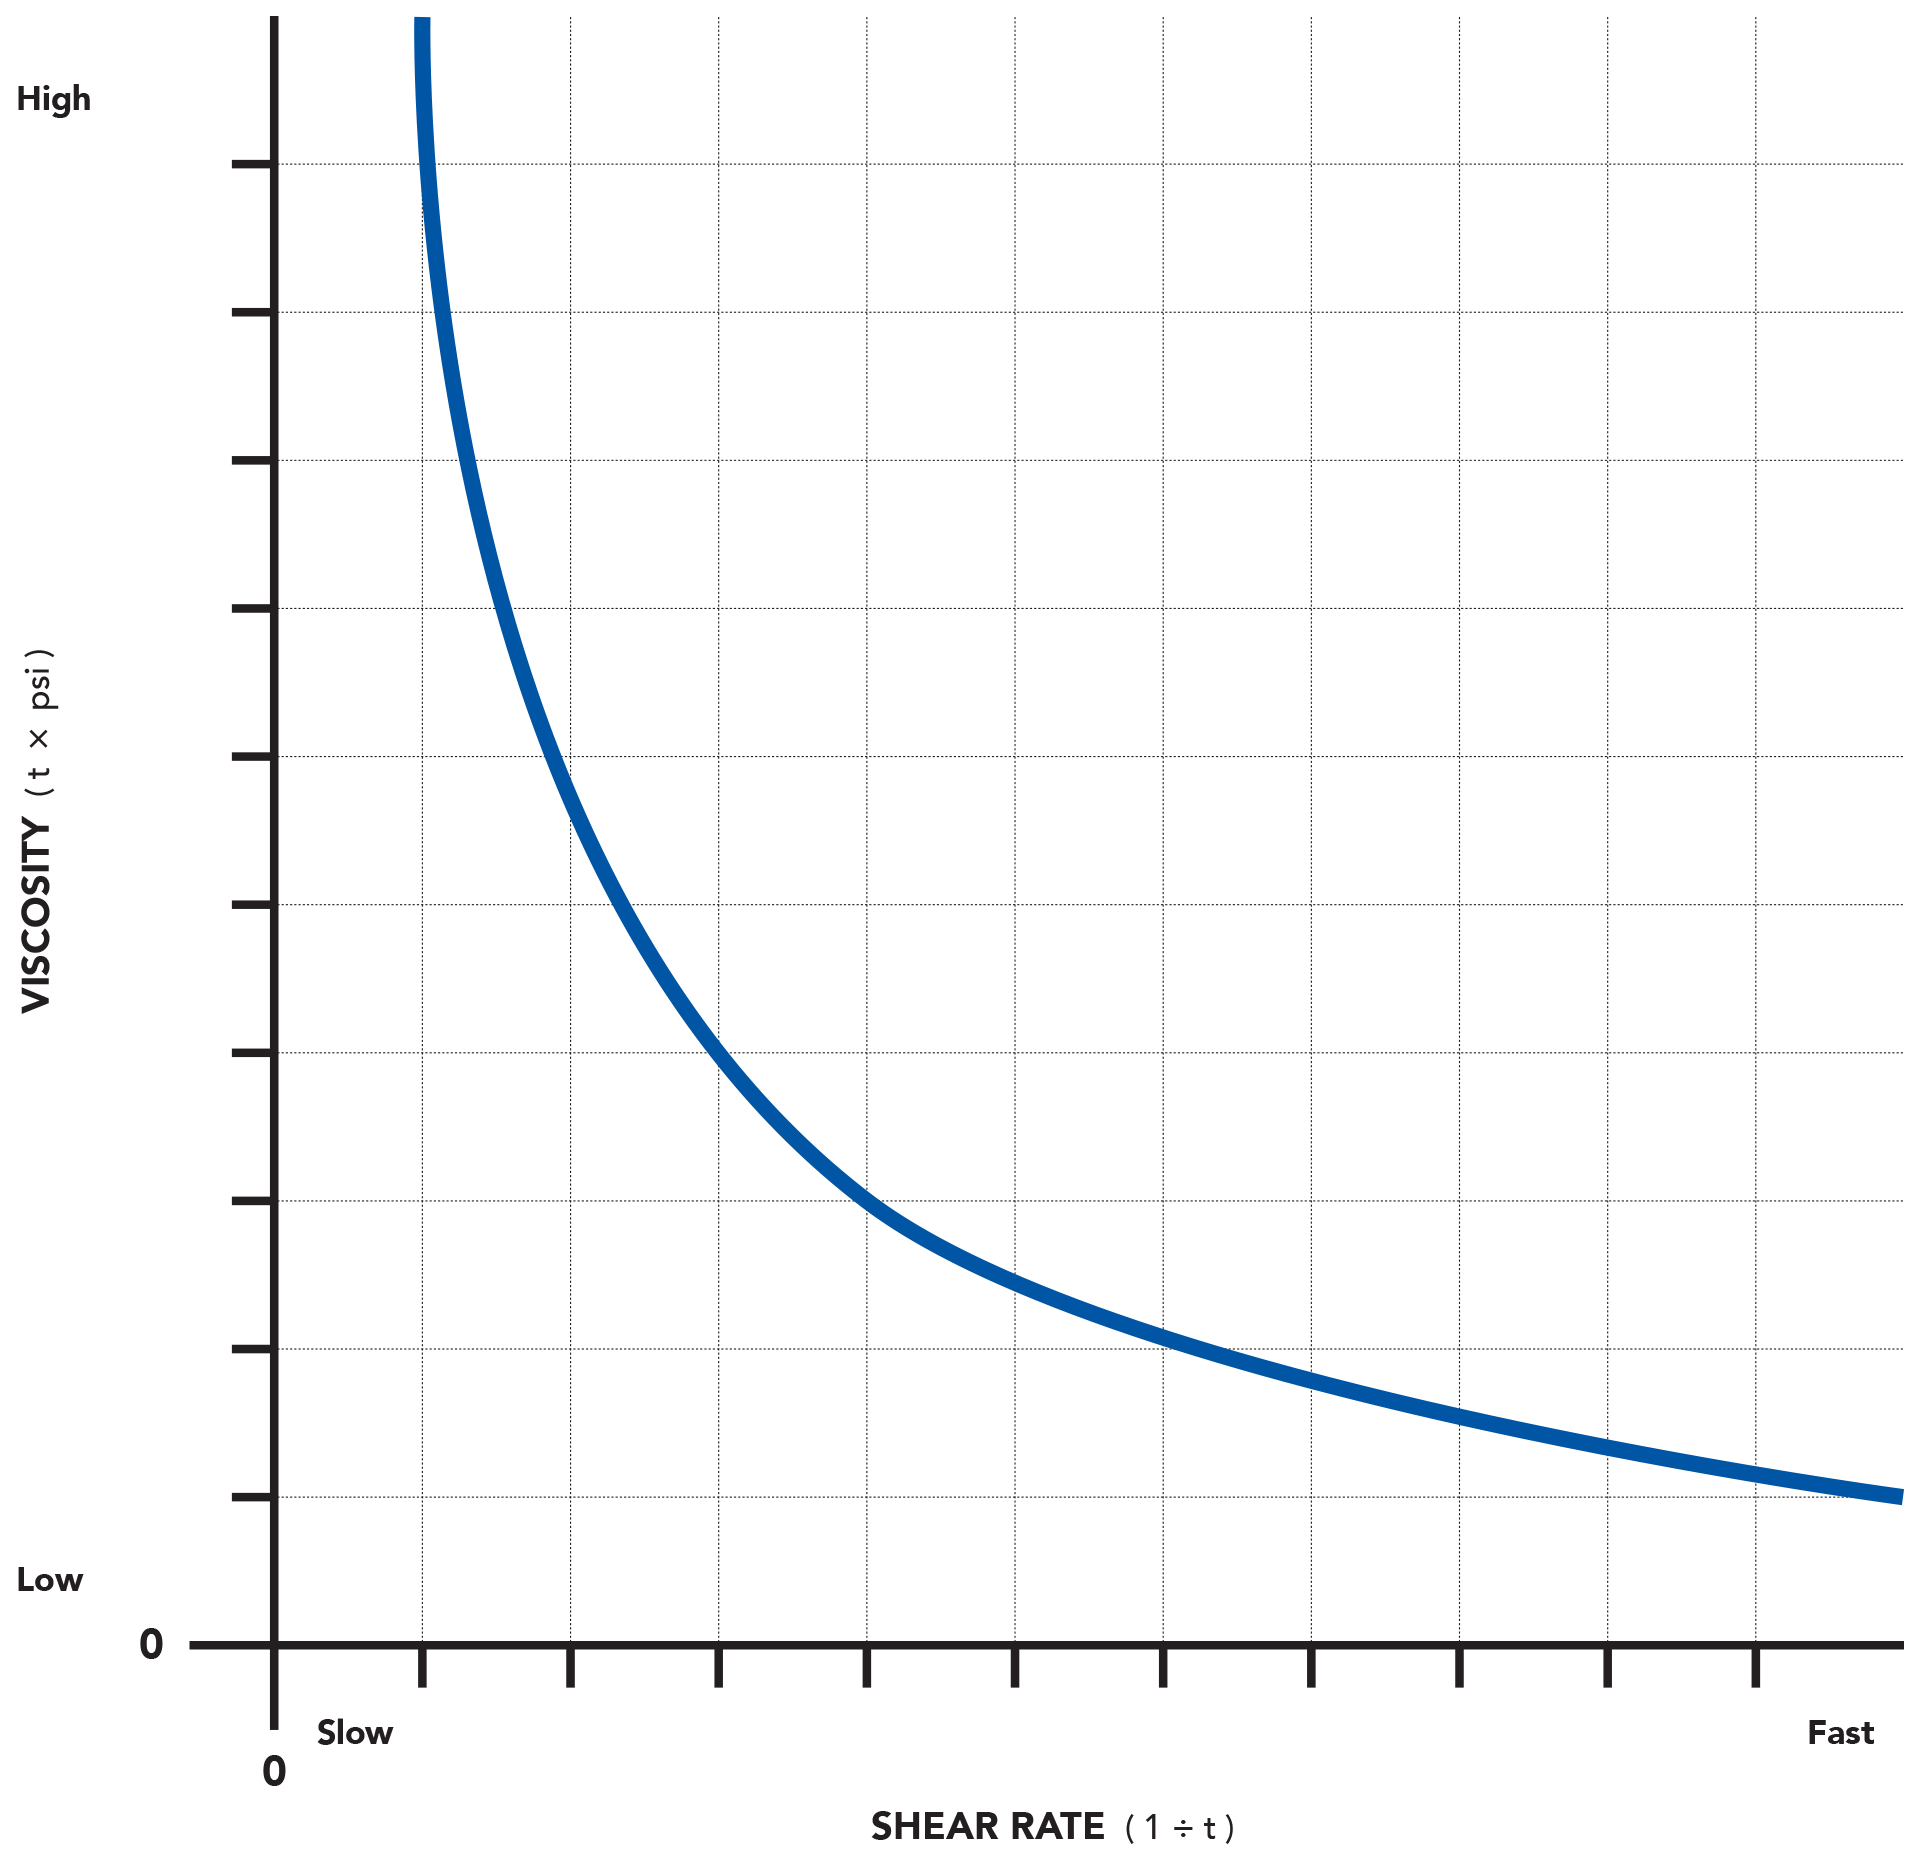
In-Mold Rheology
In-mold rheology uses a variety of injection velocities combined with machine data to generate a rheology-curve. This curve plots the effective viscosity of a polymer to help determine when shear-thinning occurs. As the shear rate (or flow rate) of the polymer increases, the viscosity decreases. This rheological behavior is unique to polymers and is called ‘shear thinning’.
When graphing this, viscosity is plotted on the vertical, ‘Y axis’ and shear rate is plotted on the horizontal, ‘X axis’.
The apparent shear rate equals 1/(fill time).
The effective viscosity equals (fill time)*(transfer pressure).
Shear thinning will appear as a steep decline in the viscosity of the polymer as the shear rate increases. Once most of the shear thinning occurs the polymer’s viscosity starts to level out. After this point, the viscosity will remain relatively consistent - resulting in a more stable process. For this reason, you should process on the right hand side of the curve.
In-Mold Rheology Curve
Plastic Materials Overview
Table of Plastic Material Properties
| Name | Grade | Spec. Grav. | Shrink % | D‑Temp °F (°C) | D‑Time (h) | Mold °F (°C) | Process °F (°C) |
|---|---|---|---|---|---|---|---|
| Acetal | Acetal | 1.39‑1.42 | 1.8‑2.2 | 175‑220 (80‑105) |
2‑3 | 170‑220 (80‑105) |
370‑440 (190‑225) |
| Acrylic | PMMA | 1.08‑1.20 | 0.2‑0.6 | 150‑200 (65‑90) |
3‑6 | 100‑200 (40‑95) |
350‑500 (175‑260) |
| Acrylonitrile Butadiene Styrene | ABS | 1.02‑1.05 | 0.4‑0.8 | 170‑200 (75‑95) |
2‑4 | 120‑190 (50‑90) |
425‑500 (220‑260) |
| Chlorinated Polyvinylchloride | CPVC | 1.20‑1.30 | 0.5‑2.5 | 160‑180 (70‑80) |
1‑2 | 50‑175 (10‑80) |
375‑435 (190‑225) |
| High Density Polyethylene | HDPE | 0.95‑0.96 | 1.5‑4.5 | 140‑160 (60‑70) |
1‑2 | 80‑100 (25‑40) |
380‑550 (195‑290) |
| High Impact Polystyrene | HIPS | 1.04‑1.06 | 0.4‑0.8 | N/A | N/A | 70‑140 (20‑60) |
410‑500 (210‑260) |
| Ionomer | Ionomer | 0.94‑0.98 | 0.4‑0.8 | 140‑175 (60‑80) |
2‑4 | 40‑120 (5‑50) |
420‑530 (215‑275) |
| Linear Low Density Polyethylene | LLDPE | 0.91‑0.93 | 1.5‑4.5 | N/A | N/A | 70‑90 (20‑30) |
325‑550 (165‑290) |
| Low Density Polyethylene | LDPE | 0.91‑0.93 | 1.5‑4.5 | N/A | N/A | 70‑90 (20‑30) |
325‑550 (165‑290) |
| Nylon‑11 | Nylon‑11 | 1.04‑1.05 | 1.0‑2.0 | 150‑200 (65‑95) |
3‑4 | 100‑150 (40‑65) |
440‑550 (225‑285) |
| Nylon‑12 | Nylon‑12 | 0.97‑1.06 | 0.6‑1.6 | 160‑200 (70‑95) |
3‑10 | 100‑180 (40‑80) |
450‑570 (230‑300) |
| Nylon‑12/12 | Nylon‑12/12 | 1.06‑1.08 | 1.0‑1.5 | 160‑220 (70‑105) |
2‑4 | 100‑250 (40‑120) |
500‑580 (260‑305) |
| Nylon‑4/6 | Nylon‑4/6 | 1.18‑1.21 | 1.6‑2.0 | 180‑220 (80‑105) |
2‑4 | 180‑300 (80‑150) |
580‑600 (305‑315) |
| Nylon‑6 | Nylon‑6 | 1.10‑1.14 | 0.8‑1.5 | 150‑200 (65‑95) |
2‑6 | 120‑200 (50‑95) |
460‑520 (240‑270) |
| Nylon‑6/10 | Nylon‑6/10 | 1.07‑1.08 | 1.0‑2.0 | 160‑200 (70‑95) |
2‑4 | 120‑220 (50‑105) |
480‑550 (250‑290) |
| Nylon‑6/12 | Nylon‑6/12 | 1.03‑1.08 | 1.0‑1.5 | 150‑200 (65‑95) |
2‑4 | 100‑200 (40‑95) |
450‑550 (230‑290) |
| Nylon‑6/6 | Nylon‑6/6 | 1.09‑1.14 | 1.0‑2.0 | 160‑220 (70‑105) |
2‑4 | 100‑200 (40‑95) |
500‑580 (260‑305) |
| PC‑ABS Alloy | PC‑ABS | 1.10‑1.14 | 0.4‑0.8 | 180‑220 (80‑105) |
3‑5 | 120‑200 (50‑95) |
480‑540 (250‑280) |
| PC‑PET Alloy | PC‑PET | 1.20‑1.22 | 0.6‑1.0 | 190‑230 (90‑110) |
3‑5 | 130‑190 (55‑90) |
490‑550 (255‑290) |
| PC‑Polyester Alloy | PC‑Polyester | 1.18‑1.22 | 0.4‑1.0 | 190‑240 (90‑115) |
3‑5 | 90‑170 (30‑75) |
480‑550 (250‑290) |
| Polyaryletherketone | PAEK | 1.37‑1.50 | 1.2‑1.6 | 300‑320 (150‑160) |
2‑10 | 300‑425 (150‑220) |
700‑800 (370‑425) |
| Polybutylene Terephthalate | PBT | 1.30‑1.34 | 0.6‑2.0 | 200‑280 (95‑140) |
2‑5 | 100‑200 (40‑95) |
450‑500 (230‑260) |
| Polycarbonate | PC | 1.15‑1.21 | 0.5‑0.8 | 240‑260 (115‑125) |
3‑5 | 160‑220 (70‑105) |
500‑620 (260‑325) |
| Polyester | Polyester | 1.36‑1.40 | 1.5‑2.0 | 200‑270 (95‑130) |
3‑4 | 60‑120 (15‑50) |
450‑510 (230‑265) |
| Polyetheretherketone | PEEK | 1.37‑1.50 | 1.0‑2.0 | 290‑310 (145‑155) |
2‑10 | 325‑425 (165‑220) |
660‑750 (350‑400) |
| Polyetherimide | PEI | 1.27‑1.36 | 0.4‑0.7 | 250‑300 (120‑150) |
4‑6 | 175‑350 (80‑175) |
640‑800 (340‑425) |
| Polyethersulfone | PES | 1.37‑1.50 | 0.8‑1.0 | 260‑300 (125‑150) |
2‑10 | 250‑360 (120‑180) |
640‑730 (340‑385) |
| Polyethylene Terepthalate | PET | 1.25‑1.40 | 0.2‑0.5 | 250‑325 (120‑160) |
3‑6 | 50‑200 (10‑90) |
480‑580 (250‑305) |
| Polyethylene Terepthalate Glycol | PETG | 1.25‑1.40 | 0.2‑0.5 | 150‑175 (65‑80) |
3‑6 | 50‑150 (10‑65) |
300‑500 (150‑260) |
| Polyphenylene Oxide | PPO | 1.05‑1.10 | 0.5‑0.7 | 190‑240 (90‑115) |
2‑4 | 140‑200 (60‑95) |
490‑590 (255‑310) |
| Polyphenylene Sulfide | PPS | 1.34‑1.40 | 1.0‑1.2 | 250‑320 (120‑160) |
2‑4 | 280‑320 (140‑160) |
580‑640 (305‑340) |
| Polypropylene | PP | 0.89‑0.92 | 1.0‑2.0 | N/A | N/A | 70‑140 (20‑60) |
390‑510 (200‑265) |
| Polystyrene | PS | 1.04‑1.06 | 0.3‑0.7 | N/A | N/A | 50‑150 (10‑65) |
350‑525 (175‑275) |
| Polysulfone | PSU | 1.23‑1.25 | 0.4‑0.8 | 250‑300 (120‑150) |
4‑16 | 200‑325 (95‑165) |
625‑725 (330‑385) |
| Polyurethane | PUR | 1.18‑1.20 | 0.4‑0.8 | 180‑280 (80‑140) |
4‑12 | 50‑150 (10‑65) |
425‑525 (220‑275) |
| Polyvinylchoride | PVC | 1.20‑1.34 | 0.5‑2.5 | 160‑180 (70‑80) |
1‑2 | 70‑125 (20‑50) |
330‑400 (165‑205) |
| Styrene Acrylonitrile | SAN | 1.07‑1.11 | 0.3‑0.7 | 160‑180 (70‑80) |
1‑2 | 110‑180 (45‑80) |
420‑500 (215‑260) |
| Thermoplastic Elastomer | TPE | 0.90‑1.15 | 0.5‑2.0 | 150‑200 (65‑95) |
2‑4 | 50‑150 (10‑65) |
350‑450 (175‑230) |
| Thermoplastic Elastomer Polyolefin | TPO | 0.91‑1.10 | 0.8‑2.0 | N/A | N/A | 50‑150 (10‑65) |
375‑500 (190‑260) |
General Information About Common Materials
ABS (Acrylonitrile Butadiene Styrene)
| Trade Names | ABEL, ASTALAC, AVP, CEVIAN, CYCOLAC, ESPREE, EXCELLOY, KRALASTIC, LUSTRAN, Nyloy, Toyolac, TRILAC, Veroplas |
| General Characteristics | ABS is an amorphous terpolymer that consists of Acrylonitrile, Butadiene, and Styrene. This polymer has good flame retardant properties, a glossy finish, and high impact resistance depending on the blend. ABS has limited weathering resistance and certain grades have a relatively high cost. |
| Applications | General purpose, automotive, housings, electrical, and thin walled parts |
| Processing Temp. Range | 425-500 °F (220-260 °C) |
| Mold Temp. Range | 120-190 °F (50-90 °C) |
Acetal or POM (Polyoxymethylene)
| Trade Names | Celcon, Delrin, Hostaform, Kepital, Lucel, Lucet, RTP, Tarnoform, Tenac, Ultraform |
| General Characteristics | A highly crystalline polymer with good creep, fatigue, solvent, and water resistance. POM is a high strength and stiff polymer with good electrical properties. |
| Applications | Gears, bearings, automotive, and industrial |
| Processing Temp. Range | 375-420 °F (190-215 °C) |
| Mold Temp. Range | 120-200 °F (50-95 °C) |
Acrylic or PMMA (Polymethyl Methacrylate)
| Trade Names | Acrylite, Acryrex, Cyrex, Cyrolite, Kamax, Lustran, Optix, Plexiglas |
| General Characteristics | PMMA is a transparent amorphous thermoplastic low cost alternative to Polycarbonate when physical strength is not needed. This material also has better environmental stability than PS or PE, making it popular for many outdoor and automotive applications. |
| Applications | Automotive, TV Screens, Furniture, Windows, Medical |
| Processing Temp. Range | 350-500°F (175-260°C) |
| Mold Temp. Range | 100-200°F (40-95°C) |
CPVC (Chlorinated Polyvinylchloride)
| Trade Names | Harvel, Corzan, CTS, BlazeMaster, TempRite, Geon, Kaneka |
| General Characteristics | CPVC is an amorphous thermoplastic that is difficult to process due to very high shear sensitivity. Many grades of CPVC exist with different chlorine concentrations that effect the properties of the material. C PVC has strong chemical resistance with better temperature resistance than PVC. |
| Applications | Wire coating, tubing, automotive, electronics, profiles, drainage, and general purpose |
| Processing Temp. Range | 375-435°F (190-225°C) |
| Mold Temp. Range | 50-175°F (10-80°C) |
HDPE (High Density Polyethylene)
| Trade Names | Alathon, Bapolene, Braskem, Formolene, Ineos, SCLAIR |
| General Characteristics | HDPE is a highly crystalline opaque polymer with low moisture absorption as well as high tensile strength, chemical resistance and impact resistance. HDPE can also be machined and processed easily. |
| Applications | Automotive, coatings, containers, film, general purpose, industrial, packaging, tanks, and wire jacking |
| Processing Temp. Range | 380-550 °F (195-290 °C) |
| Mold Temp. Range | 80-100 °F (25-40 °C) |
HIPS (High Impact Polystyrene)
| Trade Names | ASTALAC, Avantra, CERTENE, Edistir, ESPREE, POLYREX, STYRON |
| General Characteristics | HIPS is an amorphous copolymer of Polystyrene and Polybutadiene rubber which has better impact resistance and dimensional stability than GPPS but lacks the superb clarity. HIPS has good machinability and dimensional stability with a low cost. As with GPPS, HIPS has poor solvent and electrical resistance. |
| Applications | Prototypes, housings, covers, toys, and appliances |
| Processing Temp. Range | 410-500 °F (210-260 °C) |
| Mold Temp. Range | 70-140 °F (20-60 °C) |
Ionomer
| Trade Names | Bexloy, Surlyn |
| General Characteristics | Ionomers are comprised of neutral and ionized polymer segments. Ionomers typically have ethylene based performance characteristics but with the added benefits of low temperature impact, chemical, and abrasion resistance. Some grades are designed to have high gloss and barrier properties. |
| Applications | Packaging, coatings, industrial, film, liners, sheet, and automotive exteriors |
| Processing Temp. Range | 420-530 °F (215-275 °C) |
| Mold Temp. Range | 40-120 °F (5-50 °C) |
LDPE (Low Density Polyethylene)
| Trade Names | Braskem, Kemcor, Lutene, Marlex, Riblene |
| General Characteristics | LDPE is a low cost, semi-crystalline polymer with good moisture resistance and flexibility. LDPE is generally used in high volume extrusion processes. |
| Applications | Agricultural, bags, coatings, containers, film, general purpose, packaging, and electrical insulation |
| Processing Temp. Range | 325-550 °F (165-290 °C) |
| Mold Temp. Range | 70-90 °F (20-30 °C) |
LLDPE (Linear Low Density Polyethylene)
| Trade Names | Braskem, CERTENE, DOW, Flexirene, NEO-ZEX, Petrothene, ULTZEX |
| General Characteristics | LLDPE is a semi-crystalline polymer with good moisture and chemical resistance. LLDPE typically has a rather high melt flow rate and exhibits good low temperature toughness and gloss. |
| Applications | Caps, containers, medical, toys |
| Processing Temp. Range | 325-550 °F (165-290 °C) |
| Mold Temp. Range | 70-90 °F (20-30 °C) |
PA-11 (Nylon-11)
| Trade Names | ASHLENE, Rilsan |
| General Characteristics | PA-11 is a semi-crystalline polyamide with outstanding thermal, chemical, and mechanical properties. PA-11 is a versatile polymer used in demanding situations due to its good impact properties and a high working temperature. |
| Applications | Hoses, electrical/electronics, automotive, sports, and medical |
| Processing Temp. Range | 440-550 °F (225-285 °C) |
| Mold Temp. Range | 100-150 °F (40-65 °C) |
PA-12 (Nylon-12)
| Trade Names | ASHLENE, Ecomass, Fostalon, Grilamid, PLUSTEK, Rilsan, Vestamid |
| General Characteristics | PA-12 is a semi-crystalline polyamide with great dimensional stability, impact strength, and chemical resistance. PA-12 is an excellent material for many applications because of its dimensional stability and properties at low temperatures. |
| Applications | Appliance components, automotive, bushings, cell phones, gears, general purpose, household goods, housings, medical, outdoor, engineering parts, sporting goods, tools, and wheels |
| Processing Temp. Range | 450-570 °F (230-300 °C) |
| Mold Temp. Range | 100-180 °F (40-80 °C) |
PA-4/6 (Nylon-4/6)
| Trade Names | Stanyl |
| General Characteristics | PA-4/6 is a semi-crystalline polyamide with outstanding structural performance properties and dimensional stability at elevated temperatures. PA-4/6 has excellent resistance to friction and wear with good flow properties. Many grades have some sort of fiber reinforcement to enhance the mechanical properties of the material. |
| Applications | Gears, automotive, electronics, and industrial |
| Processing Temp. Range | 580-600 °F (305-315 °C) |
| Mold Temp. Range | 180-300 °F (80-150°C) |
PA-6 (Nylon-6)
| Trade Names | ALTECH, CAPRON, Durethan, Grilon, HiFill, Maxamid, Nypel, Radilon, Ultramid |
| General Characteristics | PA-6 is a semi-crystalline polyamide with great toughness and elasticity which makes it suitable for textile and oriented fibers. PA-6 also has high tensile strength and chemical resistance. |
| Applications | Textiles, fibers, zip fasteners, gears, gun frames, instrument strings, and surgical sutures |
| Processing Temp. Range | 460-520 °F (240-270 °C) |
| Mold Temp. Range | 120-200 °F (50-95 °C) |
PA-6/10 (Nylon-6/10)
| Trade Names | ALAMID, Nylene |
| General Characteristics | PA-6/10 is a semi-crystalline polyamide with a lower brittleness temperature, strength, and water absorption than other PA-6’s. PA-6/10 has good resistance to most solvents and diluted mineral acids. PA-6/10 tends to have large amount of shrinkage. |
| Applications | Electrical, filaments, and precision parts |
| Processing Temp. Range | 480-550 °F (250-290 °C) |
| Mold Temp. Range | 120-220 °F (50-105 °C) |
PA-6/12 (Nylon-6/12)
| Trade Names | ASHLENE, Nycal, Radici, Vestamid, Zytel |
| General Characteristics | PA-6/12 is a semi-crystalline polyamide with low water absorption compared to other nylons. PA-6/12 has more consistent properties than PA-6 when exposed to humidity and has good heat resistance and dimensional stability. |
| Applications | Electrical components, gears, general purpose, knife handles, gun frames |
| Processing Temp. Range | 450-550 °F (230-290 °C) |
| Mold Temp. Range | 100-200 °F (40-95 °C) |
PA-6/6 (Nylon-6/6)
| Trade Names | Celstran, Clariant Nylon 6/6, Elastoblend, HiFill, Nylene, Nymax, Polifil, Vydyne |
| General Characteristics | PA-6/6 is a semi-crystalline polyamide with good toughness and abrasion resistance. Typically used for commercial applications that will encounter extended use and abrasion. |
| Applications | Commercial grade fabrics, airbags, tires, textiles, carpets |
| Processing Temp. Range | 500-580 °F (260-305 °C) |
| Mold Temp. Range | 100-200 °F (40-95 °C) |
PAEK (Polyaryletherketone)
| Trade Names | Avaspire |
| General Characteristics | PAEK is a high performance semi-crystalline engineering thermoplastic that has extremely high temperature stability, mechanical strength, and chemical resistance. PAEK has slightly better dimensional stability and fatigue resistance than PEEK. |
| Applications | Chemical processing, electronics, medical, automotive, seals, valves, gears, and bearings |
| Processing Temp. Range | 700-800 °F (370-425 °C) |
| Mold Temp. Range | 300-425 °F (150-220 °C) |
PBT (Polybutylene Terephthalate)
| Trade Names | ABEL, ALCOM, ALTECH, ASHLENE, CELANEX, Crastin, Lutrel, PLANAC, POCAN, RAMSTER, Ultradur, VALOX, Vestodur |
| General Characteristics | PBT is a semi-crystalline polyester with good stiffness and toughness. PBT has similar properties to some nylons but with much less water absorption. PBT has a continuous service temperature of around 120°C and is often used as an electrical insulator. |
| Applications | Automotive, industrial, electronics, housings, medical |
| Processing Temp. Range | 450-500 °F (230-260 °C) |
| Mold Temp. Range | 100-200 °F (40-95 °C) |
PC (Polycarbonate)
| Trade Names | ALCOM, Apec, ASHLENE, CALIBRE, Carbotex, Durolon, Enviroplas, Hylex, LEXAN, Lupoy, Makrolon, Panlite, RAMTOUGH, TRIREX |
| General Characteristics | PC is an amorphous polymer with great impact resistance and optical clarity along with good heat resistance, toughness, and dimensional stability. Many polycarbonate products have surface coatings since PC does not have good chemical or scratch resistance. |
| Applications | Exterior automotive components, engineering components, housings, lenses, structural parts, medical components, and bullet proof sheeting |
| Processing Temp. Range | 500-620 °F (260-325 °C) |
| Mold Temp. Range | 160-220 °F (70-105 °C) |
PC/ABS (PC/ABS Alloy)
| Trade Names | Abel PC/ABS, ASTALOY, Bayblend, CYCLOY, Duroloy, EMERGE, EXCELLOY, Hybrid, Lupoy, Multilon, Novalloy-S, TECHNIACE, TRILOY, Verolloy, WONDERLOY |
| General Characteristics | PC/ABS is an amorphous thermoplastic copolymer of Polycarbonate and Acrylonitrile Butadiene Styrene. PC/ABS offers the properties of both PC and ABS including: the strength and heat resistance of PC and the flexibility of ABS. PC/ABS exhibits high toughness even at cold temperatures. |
| Applications | Automotive, electronics, medical, and aeronautical |
| Processing Temp. Range | 480-540 °F (250-280 °C) |
| Mold Temp. Range | 120-200 °F (50-95 °C) |
PC/PET (PC/PET Alloy)
| Trade Names | Makroblend, XENOY |
| General Characteristics | PC/PET is an amorphous thermoplastic blend that combines the properties of both PC and PET. It can be opaque or transparent and has high rigidity, dimensional stability, and impact resistance. |
| Applications | Sporting goods, electrical/electronic, automotive, industrial/mechanical, and household |
| Processing Temp. Range | 490-550 °F (255-290 °C) |
| Mold Temp. Range | 130-190 °F (55-90 °C) |
PEEK (Polyetheretherketone)
| Trade Names | Arlon, Ketaspire, MOTIS, PEEK-OPTIMA, VESTAKEEP, VICTREX |
| General Characteristics | PEEK is a high performance semi-crystalline engineering thermoplastic that has extremely high temperature stability and mechanical strength. PEEK has great dimensional stability, fatigue resistance, and chemical resistance with low smoke and toxic gas emission when exposed to flame. |
| Applications | Piston parts, gears, aerospace, automotive, chemical processing, and insulation |
| Processing Temp. Range | 660-750 °F (350-400 °C) |
| Mold Temp. Range | 325-425 °F (165-220 °C) |
PEI (Polyetherimide)
| Trade Names | ULTEM |
| General Characteristics | PEI is an amorphous polymer with excellent dimensional stability, chemical resistance, mechanical strength, and high temperature performance. PEI is electrically conductive which makes it suitable for some electronics applications. |
| Applications | Medical devices, microwave cookware, insulators, automotive, electrical/electronics, and metal replacement |
| Processing Temp. Range | 640-800 °F (340-425 °C) |
| Mold Temp. Range | 175-350 °F (80-175 °C) |
PES (Polyethersulfone)
| Trade Names | HiFill PES, Ratron, SUMIKAEXCEL, TRIBOCOMP, Ultrason |
| General Characteristics | PES is an amorphous transparent polymer with good stiffness and heat resistance. PES is suitable for high continuous use temperatures over extended periods of time. PES has high rigidity and dimensional stability over a broad temperature range. PES is susceptible to UV degradation and weathering. |
| Applications | Medical, automotive, industrial, pistons, filters/membranes, and electrical/electronics |
| Processing Temp. Range | 640-730 °F (340-385 °C) |
| Mold Temp. Range | 250-360 °F (120-180 °C) |
PET (Polyethylene Terepthalate)
| Trade Names | Ultrason, Valox, Hiloy, Impet, Petra, Shulandur, Ektar, Rynite, Selar, Dacron, Terylene |
| General Characteristics | PET is a semi-crystalline thermoplastic that is commonly used for synthetic polyester fibers and plastic bottle production. Most bottle manufacturers control the clarity of PET by limiting the degree of semi-crystallinity since higher levels of semi-crystallinity cause the product to turn opaque. PET has excellent has strong chemical resistance and can withstand temperatures in excess of 212°F (100°C). |
| Applications | Bottles, fibers, synthetic fabrics, films, and packaging |
| Processing Temp. Range | 480-580°F (250-305°C) |
| Mold Temp. Range | 50-200°F (10-90°C) |
PETG (Polyethylene Terepthalate Glycol)
| Trade Names | Spectar, Vivak, Eastar |
| General Characteristics | PETG is an amomrphous thermoplastic which has similar properties to PET but with better mechanical and dimensional stability. PETG also has greater clarity and impact resistance than PET which makes it very popular for packaging applications such as thermoforming. |
| Applications | Fibers, films, and packaging |
| Processing Temp. Range | 300-500°F (150-260°C) |
| Mold Temp. Range | 50-150°F (10-65°C) |
PP (Polypropylene)
| Trade Names | Braskem, CERTENE, COPYLENE, Exelene, FERREX, Formolene, GAPEX, Hostacom, INEOS, Maxxam, Polifil, POLYFLAM, Pro-fax, RAMOFIN, TIPPLEN, YUPLENE |
| General Characteristics | PP is a versatile semi-crystalline polymer with high impact resistance and melt flow rates. PP is a resilient polymer that acts as a living hinge when cyclically loaded or fatigued. PP is difficult to bond with adhesives and has poor low temperature impact strength. |
| Applications | Automotive, films, containers, industrial applications, general purpose, and living hinge applications |
| Processing Temp. Range | 390-510 °F (200-265 °C) |
| Mold Temp. Range | 70-140 °F (20-60 °C) |
PPO (Polyphenylene Oxide)
| Trade Names | Fiberfil, Noryl |
| General Characteristics | PPO is an amorphous engineering plastic with high temperature resistance, dimensional stability, and electrical resistance along with low thermal expansion. PPO is sensitive to organic solvents and is susceptible to environmental stress cracking. |
| Applications | Pumps, valves, fittings, electrical components, manifolds, covers, housings, and coatings |
| Processing Temp. Range | 490-590 °F (255-310 °C) |
| Mold Temp. Range | 140-200 °F (60-95 °C) |
PS (Polystyrene)
| Trade Names | Amoco, Bapolan, Eporex, Styron, Valtra |
| General Characteristics | PS is an inexpensive amorphous polymer with great optical clarity. Unfilled polystyrene is typically called GPPS (general purpose polystyrene) and is rigid but brittle. PS can be used in virtually all processes, making it extremely versatile in the marketplace. PS has poor thermal stability and solvent resistance. |
| Applications | Toys, packaging, sheet, housings, appliances, household goods, and expanded beads |
| Processing Temp. Range | 350-525 °F (175-275 °C) |
| Mold Temp. Range | 50-150 °F (10-65 °C) |
PVC (Polyvinylchloride)
| Trade Names | APEX, Geon, Georgia Gulf, Manner, Reinier, Roscom, Sylvin, Unichem |
| General Characteristics | PVC is an amorphous thermoplastic that is difficult to process as a homopolymer. Many grades of PVC exist with different plasticizer concentrations that effect the processing of the material. Rigid PVC has strong chemical resistance and moderate temperature resistance. PVC has poor UV resistance. |
| Applications | Wire coating, tubing, automotive, electronics, profiles, general purpose, and medical |
| Processing Temp. Range | 330-400 °F (165-205 °C) |
| Mold Temp. Range | 70-125 °F (20-50 °C) |
SAN (Styrene Acrylonitrile)
| Trade Names | FORMPOLY, KIBISAN, Kumho, LG SAN, Lustran, Porene, SANREX, Veroplas |
| General Characteristics | SAN is an amorphous copolymer of styrene and acrylonitrile. SAN has higher strength, rigidity, and chemical resistance than polystyrene but lacks the same optical clarity. SAN has poor impact strength and low thermal capabilities. |
| Applications | Electrical, appliances, cosmetics, medical, containers, and automotive |
| Processing Temp. Range | 420-500 °F (215-260 °C) |
| Mold Temp. Range | 110-180 °F (45-80 °C) |
TPC-ET (Thermoplastic Copolyester Elastomers)
| Trade Names | Arnitel, Elitel, Hytrel, Keyflex, Riteflex |
| General Characteristics | TPC-ET polymers are amorphous thermoplastic copolymers that exhibit the flexibility of rubbers and the strength and processability of thermoplastics. TPC-ET blends have excellent flex fatigue resistance and a broad use temperature. They have good toughness and resist hydrocarbons. |
| Applications | Adhesives, cast film, coatings, filaments, hose, sheet, and tubing |
| Processing Temp. Range | 490-550 °F (255-290 °C) |
| Mold Temp. Range | 130-190 °F (55-90 °C) |
TPE (Thermoplastic Elastomer)
| Trade Names | Ecdel, Estamid, Estane, Hytrel, Kraton, Ontex |
| General Characteristics | A TPE is an amorphous copolymer of thermoplastic and elastomeric monomers and properties. TPEs can come in many classes including block-copolymers, polyolefin blends, and thermoplastic polyurethanes to name a few. Generally, these polymers have high heat resistance and ozone resistance. |
| Applications | Gaskets, automotive, sporting goods, tubing, and medical |
| Processing Temp. Range | 350-450 °F (175-230 °C) |
| Mold Temp. Range | 50-150 °F (10-65 °C) |
TPO (Thermoplastic Polyolefin)
| Trade Names | Exxtral, Lupol |
| General Characteristics | A TPO is a polymer/filler blend consisting of some fraction of polyolefin(s) and reinforcements. They have good dimensional stability and usually have a balance between stiffness and impact resistance in semi-structural and non-structural applications. |
| Applications | Appliances, automotive, electrical, consumer, packaging, and nonwovens |
| Processing Temp. Range | 375-500 °F (190-260 °C) |
| Mold Temp. Range | 50-150 °F (10-65 °C) |
PPS (Polyphenylene Sulfide)
| Trade Names | Fortron, Ryton, Sultron, TEDUR, Thermec, Xtel |
| General Characteristics | PPS is a semi-crystalline polymer which usually contains fillers or reinforcements. PPS has excellent ionizing radiation and chemical resistance. PPS is self-extinguishing and has low toxicity smoke when exposed to flame. |
| Applications | Chemical pumps, electrical components, coatings, piping, rods, and seals |
| Processing Temp. Range | 580-640 °F (305-340 °C) |
| Mold Temp. Range | 280-320 °F (140-160 °C) |
PSU (Polysulfone)
| Trade Names | Udel, Ultrason |
| General Characteristics | PSU is an amorphous polymer with good stiffness and heat resistance. PSU is transparent and maintains good mechanical properties over a wide temperature range. PSU has one of the highest service temperatures of melt-processable thermoplastics which can be autoclaved and steam sterilized without any loss in physical integrity. |
| Applications | Medical, electrical/electronics, filters, industrial, and aerospace |
| Processing Temp. Range | 625-725 °F (330-385°C) |
| Mold Temp. Range | 200-325 °F (95-165 °C) |
PUR (Polyurethane)
| Trade Names | Chronothane, Hydrothane, Polyblend |
| General Characteristics | PURs are a large family of polymers that may be thermoset or thermoplastic polymers with a broad array of properties. PUR has high abrasion resistance and is typically used as a coating, foam, or elastomer copolymer. These polymers tend to be weak to UV rays and most organic solvents. |
| Applications | Adhesives, bushings, coatings, insulation, piping, sealants, sheet, washers, and wheels |
| Processing Temp. Range | 425-525 °F (220-275 °C) |
| Mold Temp. Range | 50-150 °F (10-65 °C) |
Properties, Additives & Preparation
Common Fillers and Fibers
Fillers and fibers are generally added to plastic materials to increase mechanical, chemical, or electrical properties as well as to reduce material costs in some cases. Reinforcing fibers such as carbon or glass are used to enhance mechanical properties while talc and clay are used as fillers.
Common Fillers and Fibers
Alumina |
Calcium Carbonate |
Carbon Black |
Clay |
Glass Bubbles |
Glass Fibers |
Graphite |
Quartz |
Talc |
Molydenum Disulfide |
Wollastonite Silicate |
|
|---|---|---|---|---|---|---|---|---|---|---|---|
| ABS | • | • | • | ||||||||
| Acetal | • | ||||||||||
| Acrylic | • | ||||||||||
| Nylon | • | • | • | • | • | • | • | ||||
| Polycarbonate | • | ||||||||||
| Polyester TP | • | ||||||||||
| Polyethylene | • | • | • | • | • | • | |||||
| Polypropylene | • | • | • | • | • | • | |||||
| Polystyrene | • | • | • | • | • | ||||||
| Polysulfone | • | ||||||||||
| Polyurethane | • | • | • | • | • | • | |||||
| PPO Modified | • | ||||||||||
| PVC (Rigid) | • | • | • | • | • | • | • | • | • |
Effect of Glass Fibers on Mechanical Properties
| ASTM D792 | ASTM D995 | ASTM D638 | ASTM D790 | ASTM D648 | ASTM D696 | |
|---|---|---|---|---|---|---|
| Specific Gravity | Shrink % | Tensile Strength kPsi (Mpa) |
Flexural Modulus kPsi (Mpa) |
Deflection Temp. 264 Psi (1.8MPa) °F (°C) |
Thermal Expansion % per °F (% per °C) |
|
| ABS | 1.05 | 0.6 | 6 (41) | 320 (2200) | 195 (91) | 0.0053 (0.0095) |
| 30% Glass | 1.28 | 0.1 | 14.5 (210) | 1100 (7600) | 220 (104) | 0.0016 (0.0029) |
| Acetal | 1.42 | 2.0 | 8.8 (60) | 400 (2800) | 230 (110) | 0.0045 (0.0081) |
| 30% Glass | 1.63 | 0.3 | 19.5 (134) | 1400 (9600) | 325 (163) | 0.0022 (0.0040) |
| Nylon 6 | 1.14 | 1.6 | 11.8 (81) | 400 (2800) | 167 (75) | 0.0046 (0.0083) |
| 30% Glass | 1.37 | 0.4 | 23 (158) | 1200 (8300) | 420 (216) | 0.0017 (0.0031) |
| Nylon 6/6 | 1.14 | 1.8 | 11.6 (80) | 410 (170) | 170 (77) | 0.0045 (0.0081) |
| 30% Glass | 1.37 | 0.4 | 26 (180) | 1300 (9000) | 490 (254) | 0.0018 (0.0032) |
| PPO | 1.06 | 0.5 | 9.5 (65) | 360 (2500) | 265 (129) | 0.0033 (0.0059) |
| 30% Glass | 1.27 | 0.2 | 21 (144) | 1300 (9000) | 310 (154) | 0.0014 (0.0025) |
| Polycarbonate | 1.2 | 0.6 | 9 (62) | 330 (2300) | 265 (129) | 0.0037 (0.0067) |
| 30% Glass | 1.43 | 0.1 | 18.5 (127) | 1200 (8300) | 300 (149) | 0.0013 (0.0023) |
| Polyester T.P. | 1.31 | 2.0 | 8.5 (59) | 340 (2300) | 130 (54) | 0.0053 (0.0095) |
| 30% Glass | 1.52 | 0.3. | 19.5 (134) | 1400 (9600) | 430 (221) | 0.0012 (0.0022) |
| HDPE | 0.95 | 2.0 | 2.6 (18) | 200 (1400) | 120 (49) | 0.0060 (0.0108) |
| 30% Glass | 1.17 | 0.3 | 10 (69) | 900 (6200) | 260 (127) | 0.0027 (0.0049) |
| Polypropylene | 0.91 | 1.8 | 4.9 (34) | 180 (1200) | 135 (57) | 0.0040 (0.0072) |
| 30% Glass | 1.13 | 0.4 | 9.8 (68) | 800 (5500) | 295 (146) | 0.0020 (0.0036) |
| Polystyrene | 1.07 | 0.4 | 7 (48) | 450 (3100) | 180 (82) | 0.0036 (0.0065) |
| 30% Glass | 1.28 | 0.1 | 13.5 (93) | 1300 (9000) | 215 (102) | 0.0019 (0.0034) |
| Polysulfone | 1.24 | 0.7 | 10 (69) | 400 (2800) | 340 (171) | 0.0031 (0.0056) |
| 30% Glass | 1.45 | 0.3 | 18 (124) | 1200 (8300) | 365 (185) | 0.0014 (0.0025) |
| SAN | 1.08 | 0.5 | 9.8 (68) | 500 (3400) | 200 (93) | 0.0034 (0.0061) |
| 30% Glass | 1.31 | 0.1 | 17.4 (120) | 1500 (10000) | 215 (102) | 0.0018 (0.0032) |
Heat Resistance
The safe continuous heat resistance temperature of plastics is an important factor in many applications. Although a polymer like PTFE has a high heat resistance temperature of 550°F it lacks most of its mechanical properties at that point. The following figure shows the continuous heat resistance temperatures of plastics but it does not necessarily mean the plastic will maintain optimal mechanical properties at that point.
Continuous Heat Resistant Temperature of Plastics
| °C | °F | |
|---|---|---|
| 316 | 600 | Most Plastic Materials Char or Burn |
| 302 | 575 | |
| 288 | 550 | PTFE |
| 274 | 525 | |
| 260 | 500 | Polyimide |
| 246 | 475 | |
| 232 | 450 | Phenolic Asbestos Filled |
| 218 | 425 | Silicone Mineral Filled |
| 204 | 400 | |
| 191 | 375 | PCTFE |
| 177 | 350 | |
| 163 | 325 | Polysulfone |
| 149 | 300 | Alkyds, Phenolics, Chlorinated Polyether |
| 135 | 275 | |
| 121 | 250 | Melamine, Nylon, Polypropylene, PPO, Polycarbonate |
| 107 | 225 | ABS/Polycarbonate Alloy |
| 93 | 200 | Acetal, ABS, Surlyn, Noryl, Polyurethane |
| 79 | 175 | Acrylics, Cellulosics, Polyethylene, Polystyrene, SAN, Vinyls |
| 66 | 150 | Urea |
| 52 | 125 | |
| 38 | 100 | |
| 24 | 75 | Room Temperature |
| 10 | 50 |
Hardness
The hardness of a plastic is usually recorded as a measure of the resistance of the material to indentation by a steel ball or point under load. The hardness is expressed as a number derived from the net increase in depth of the indentation during the hardness test. Since all plastics have unique characteristics, the observed hardness is a time dependent value which will change with the rate of loading.
Hardness of Common Plastic Materials
| Rockwell | Durometer | Barcol | ||
|---|---|---|---|---|
| M | R | Shore D | ||
| ABS | 85‑109 | |||
| Acetal | 94 | 120 | ||
| Acrylic | 85‑105 | 49 | ||
| Cellulosics | 30‑125 | |||
| PTFE | 50‑65 | |||
| PCTFE | 75‑95 | 76 | ||
| Ionomer | 60 | |||
| PPO | 78 | 119 | ||
| Nylon 66 | 108‑120 | |||
| Nylon 6 | 120 | |||
| Polycarbonate | 70 | 116 | ||
| Polyester Rigid | 65‑115 | 30‑50 | ||
| HDPE | 60‑70 | |||
| MDPE | 50‑60 | |||
| LDPE | 41‑46 | |||
| PP | 90‑110 | 75‑85 | ||
| GPPS | 68‑80 | |||
| Vinyl Rigid | 117 | 65‑85 | ||
| Vinyl Plasticized | 40‑100 Shore A |
|||
| Urea Cellulose | 110 | |||
| Silicone | 84 | |||
| Polysulfone | 69 | 120 | ||
| Polyester | 80 | |||
Burn Characteristics
Sometimes a plastic material is identified by its burn characteristics. The table below illustrates the various characteristics of plastics when ignited.
CAUTION: Any burn test should be done with the proper safety equipment and a ventilated hood.
Burn Characteristics of Plastics
| Material | Color | Odor | Speed |
|---|---|---|---|
| PE | Bright Blue Core | Paraffin | Fast |
| PP | Bright Blue Core | Acrid / Diesel fumes | Slow |
| PS | Yellow | Marigold | Fast |
| ABS | Yellow | Acrid | Slow |
| POM | Bluish | Formaldehyde | Slow |
| PA | Bluish | Burnt Hair | Slow |
| PC | Yellow | Phenol | Slow |
| CA | Greenish/ Yellow | Vinegar | Slow |
| PET | Yellow | Burnt Rubber | Fast |
| ABS/PC | Yellow | Acrid/Phenol | Slow |
| PVC-U | Greenish/ Yellow | Hydrochloric | Slow |
| PVC-P | Greenish/ Yellow | Hydrochloric | Slow |
Feed Zone Temperature Study
To determine the optimal feed zone temperature for your process, you can perform a feed zone temperature study. This study determines the optimum feed zone temperature by graphing feed zone temperature vs. screw recovery time.
Starting with a low feed zone temperature, incrementally raise the temperature and document the screw recovery time at each increment. When graphed, the screw recovery time will drop and then rise as the temperature is increased.
The optimal feed zone temperature is the temperature that results in the shortest screw recovery time. This is the temperature where the polymer sticks best to the barrel and it’s conveyed most efficiently.
Once the optimal feed zone temperature is determined, you should adjust the rotational speed of the screw so that screw recovery consumes 80% of the overall cooling time.
Note that the back pressure used during screw recovery should be high enough to provide a consistent recovery time and consistent mixing. Your recovery times should not vary more than 5% from shot to shot, and 10% from material lot to material lot.
Establishing a Scientific Molding Process
A scientific molding process is an efficient and repeatable molding process which is stable and reliable with a large processing window. Although there are many facets to a scientific molding process, the general attributes are as follows:
- The process uses one injection speed to fill, whenever possible
- The mold fills 95% to 98% full during 1st stage
- All cavities are short shot during 1st stage
- 1st stage fill is velocity-controlled and not pressure limited
- Process uses 20% to 80% of the machine’s available shot size
- Final cushion is approximately 10% of the overall shot size
1st Stage Filling
Since polymer viscosity decreases as injection rate is increased, higher injection speeds allow the polymer to flow into the mold more easily. At these higher rates, shear thinning causes more consistent viscosity. This promotes a more consistent and reliable process.
Using a single injection speed simplifies the process and improves consistency. If defects occur with one speed, then multiple speeds can be used. This is referred to as ‘injection profiling’. The best use of injection profiling is to solve specific defects.
When filling, it is critical to ensure you are not using a ‘pressure-limited’ process. If the maximum injection pressure setting is inadequate, the screw will slow down during injection to create what is known as a ‘pressure-limited process’. When injection becomes pressure-limited, the machine can no longer maintain the desired injection rate, resulting in an inconsistent fill rate and injection time.
1st Stage to 2nd Stage Transfer
You should transfer from 1st stage fill to 2nd stage pack before the mold is completely filled to ensure optimal efficiency and consistency. Such a process will be able to better compensate for variations in material viscosity. With a poorly established transfer, an increase in viscosity is likely to cause a short shot, while a decrease in viscosity results in flash. A process with fluctuating transfer is unlikely to be consistent over time, resulting in flash, short shots, and sinks.
2nd Stage Pack
To determine the appropriate 2nd stage time for your process, you should perform a Gate Seal Study. This study determines adequate 2nd stage packing time by graphing part weight vs. 2nd stage time.
When graphed, the part weight will increase until the gate freezes. The optimal 2nd stage time is the time at which the part weight does not increase with an increase in 2nd stage time.
Screw Delay or Decompression Before Recovery
To prevent screw damage during recovery, either screw delay or screw decompression can be used. The screw delay option adds a delay after 2nd stage packing to relieve the pressure on the screw prior to recovery. Although each process is different, the screw delay time should be enough to allow the injection pressure graph to drop to zero before recovery starts.
In some high-speed applications, screw decompression or suck-back can be used to relieve the pressure at the front of the screw. This option backs the screw up before starting screw recovery.
Screw Recovery
To determine the optimal feed zone temperature for your process, you should perform a feed zone temperature study. The purpose of the feed zone temperature study is to determine an adequate feed zone temperature by graphing screw recovery time versus feed zone temperature. When graphed, the screw recovery time will drop and then rise as the temperature is increased. The optimal feed zone temperature is the temperature at which the screw recovery time is the lowest.
Once the feed zone temperature is determined, adjust the rotational speed of the screw so that recovery consumes 80% of the overall cooling time. For example, if your process has a 10 second cooling time, your shot should be recovered approximately 2 seconds before the cooling time is finished.
Screw Decompression After Recovery
For most screws, the optimal amount of ‘screw suck back’ should be equal to the amount of ‘check ring travel’. Since the size and configuration of check ring assemblies vary, you should ask the manufacturer or pull the screw and measure the check ring travel.
Cooling
To establishing cooling, begin with a longer cooling time than should be necessary. You can first determine the lowest mold temperature which provides an acceptable part. Once this mold temperature is established, you can lower the cooling time to determine the lowest cooling time which provides an acceptable part.
Seven Steps to Scientific Troubleshooting
STEP 1: Develop a Scientific Molding Process
A scientific molding process consists of the following attributes:
1st Stage Injection
During this stage, the mold is filled using screw velocity control. There should always be enough injection pressure available to ensure the machine can maintain the desired velocity setpoint.
1st to 2nd Stage Transfer
Transfer should take place using screw position. The mold should be approximately 95% full at the time of transfer. The resulting part should be a visual short shot.
2nd Stage Packing Pressure
Pressure must be high enough to finish filling the mold cavity and pack out all sinks and voids. 2nd Stage Packing Pressure is typically 50-75% of 1st Stage Pressure.
2nd Stage Time
Determine the appropriate 2nd Stage Time for your process by performing a gate seal study. The Gate Seal Study will help determine an adequate 2nd Stage Packing Time at which the part weight does not increase with an increase in 2nd Stage Time.
Screw Delay or Decompression Before Recovery
After 2nd Stage Pack there is a large amount of pressure present in front of the screw. Either screw delay or screw decompression should be used before recovery to prevent damage.
Screw Recovery
During screw recovery, screw recovery should consume 80% of the overall cooling time. If there is a long cooling time, then a significant screw delay can be used to reduce the time the material remains in the barrel.
Screw Decompression After Recovery
When the screw travels forward for injection the pressure holding the check ring in the forward position can interfere with the check ring movement. Screw decompression is necessary to prevent interference. The proper amount of ‘screw suck back’ should be equal to the amount of ‘check ring travel’.
STEP 2: Properly Document the Process Outputs
The documented process outputs are those which result of a process where acceptable parts are produced. Many of these parameters are the same as the process inputs but each of these parameters would be consistent from one machine to another.
Examples of machine independent process parameters include:
- Melt Temperature
- Coolant Temperature Entering and Leaving the Mold
- Coolant Flow
- 1st Stage Fill Time
- 1st Stage Fill Weight
- 2nd Stage Packing Time
- 2nd Stage Plastic Pressure
- Gate Seal Time
- Cooling Time
- Plastic Back Pressure
- Screw Recovery Time
- Overall Cycle Time
- Final Part Weight
- Clamp Tonnage
- Dewpoint
You can also document any important information such as photographs, observations, and quality information.
STEP 3: Examine Defective Part and Rule-Out Obvious Causes
Once a non-conformance occurs, the first thing to do is to thoroughly inspect the part to ensure other defects are not present. If any aspect of the process, mold, machine, or material is obviously suspect, then this should be investigated first.
For example, let’s suppose a part may have been identified to have flash. With only this information, the traditional troubleshooter may investigate aspects such as the clamp tonnage, transfer position, packing pressure, or barrel temperatures. Now, let’s assume further inspection took place, and the scientific troubleshooter determines the part also has splay. With this additional information, it may be possible to conclude that both the flash and splay could be the result of moisture in the material.
STEP 4: Compare Current Process with Documented Process
Once obvious causes are ruled out, the next logical step is to compare the current process with the documented standard. Since a well-documented process contains a variety of parameters, it is best to start by reviewing the parameters which most likely relate to your defect.
As you compare the documented standard to the current process, you will determine the aspects of the process which have changed from the standard. A scientific troubleshooter can use this information to help make educated decisions about which parameters need to be changed to bring the process back to the documented standard.
For example, if the part is showing degradation, you should first compare parameters such as melt temperature, back pressure, and 1st stage injection time.
Likewise, if flash, short shots, or sinks are present, it is best to turn off 2nd stage packing to verify all the process outputs related to injection such as 1st stage fill time, 1st stage fill weight, plastic pressure at transfer from 1st stage to 2nd stage.
STEP 5: Return the Process to the Documented Standard
Without accurate knowledge about which processing parameters have changed, the scientific troubleshooter cannot begin to make changes to return the process outputs to the documented standard. Always be careful of related process parameters.
For example, if the 1st stage fill time is too high and the 1st stage fill weight is too low, then an increase in the injection speed may bring both parameters back to the documented standard.
The goal here is not to just fix the defect, but to return the machine independent process outputs back to the documented standard. When steps 1 and 2 are conducted properly, the scientific troubleshooter has confidence that the parts will be acceptable when the process is returned to the documented standard if the mold, machine, and material are behaving properly. This troubleshooting method will also help the scientific troubleshooter to quickly identify and isolate a problem with the equipment or material.
STEP 6: Verify the Part and Process
After the parts are brought into conformance, it is best to ensure that both the part and process are brought to the standard. This means the scientific troubleshooter should take a few minutes to check each of the parameters which are easy to verify.
It may be impractical to check every process output, but any information which is easily obtained such as 1st stage fill time, 1st stage fill weight, cycle time, cooling time, etc. will help increase the confidence that the process will remain stable and reliable over time.
STEP 7: Document All Changes Made
This is one step any troubleshooter, scientific or traditional, will derive benefits from. A trail of documentation should begin when the process was established and approved, and continue to build as the process is adjusted to create a portfolio of information to draw upon when trouble arises. A scientific troubleshooter should be able to see the full history of the process, machine, mold, during this time.
For example, if an employee on first shift corrected the process by increasing transfer position, this would be invaluable information for the second shift technician when they encounter a defective part, such as a sink.
If a systematic approach to processing and documentation is used when the process is established a scientific troubleshooter will be able to correct the problem in a relatively short time with a significantly high degree of confidence. Ultimately, good troubleshooting is just an extension of good processing. The more effectively you process and document, the more efficiently you will troubleshoot when non-conformances occur.
Defects
Visual Defects
Flash
Flash is excessive, unwanted material located on the edge of the part. This is a result of material passing through the parting line or between mold components.
Flash near the center of the mold or the gate may indicate low melt temperature as the problem. If the temperature of the melt is too high, the melt viscosity will drop, especially if the material degrades. This high-temperature melt with low viscosity may cause too much material to flow into the mold during 1st stage fill, resulting in flash.
During 1st stage injection, excessive amounts of material, high injection velocity, or a cavity filling imbalance can lead to flash. Also, excess 2nd stage pressure or a low clamp tonnage can also lead to flash. Mold faults such as excessive wear or mold damage and machine faults like an inconsistent check ring or excessive platen deflection can also attribute to flash.
Sinks and Voids
Sink are depressions on the part surface where the material shrinks away from the mold surface. Voids are sections in the center of the part where material shrinks away from itself, leaving a small cavity within the part. To ensure the defect is a void and not a gas bubble, you should mold parts at various injection speeds. If the defect remains stationary, it is most likely a void. Since both sinks and voids are the result of shrinkage, the causes and corrections are often similar.
A low melt temperature will cause larger pressure losses during injection. A high temperature melt causes additional shrinkage during cooling. Both of these conditions can result in sinks or voids.
During 1st stage injection, insufficient shot size or low injection speed may cause sinks and voids to form. If too little pressure is used during 2nd stage packing, insufficient material will enter the cavity to compensate for material shrinkage.
If the 2nd stage time is insufficient, material will flow back through the gate before it seals which will result in sinks on the part in areas near the gate. A mold that is too cold (causing the polymer to freeze quickly) and a hot mold (that increases the amount of shrinkage) will both cause sinks and voids to occur.
Short Shots
A short shot is an incompletely filled mold cavity. This can be a result of many different variables. A low temperature, high viscosity polymer may prevent the mold from filling enough during 1st stage fill. During 1st stage, the packing pressure or injection velocity may not be high enough to complete mold filling.
Trapped gas during 1st stage fill can cause a short shot. Excessive clamp tonnage can compress mold vents and prevent gas from exiting the mold during fill. Damaged or clogged vents can also result in gas entrapment.
If the 2nd stage pressure is significantly low, there may not be enough pressure to complete mold filling. Also, a significantly low mold temperature may cause an excessive pressure drop to occur during 1st stage fill – resulting in a short shot.
Jetting
If the mold or polymer is at a low temperature, the high viscosity polymer may not adhere to the mold surface properly, resulting in jetting. High injection speeds will also create excessive shear at the gate area and jetting may occur. Poor gate design typically contributes to the presence of jetting.
Smaller, more restrictive, gates increase the shear rate within the gate and will increase the likelihood of jetting. When the material is gated into relatively large areas, it is harder to create a smooth laminar flow.
Gate Blush
Gate blush appears as rings or ripples in the gate area of the part. This occurs when material slides across the mold surface rather than forming a fountain flow and freezing to the surface. As more material enters the mold cavity, it erodes the material off of the mold surface, causing the blushed appearance.
If a high injection velocity is being used during 1st stage injection, the polymer may pass through the gate too quickly – creating excessive shear. A high mold temperature may interfere with the development of the solidified layer of plastic against the mold wall and gate blush can occur. Restrictive gates such as pinpoint, submarine, and cashew gates tend to contribute to the presence of gate blush.
Inadequate cooling around the gate area tends to promote flow front slippage resulting in gate blush.
Burning
Burning, or dieseling, appears as a black, gray, or brown discoloration on the surface of the part. This is the result of gasses and volatiles becoming trapped, compressed, and heated in the mold during 1st stage injection. This gas will burn the front of the polymer flow front. Burning typically occurs near the end of fill, or where the flow ends, such as the bottom of a boss or rib.
Excessively high melt temperatures and back pressures can often cause the material additives to burn off and degrade during recovery.
If the injection speed of the polymer is excessive for the mold, the polymer may displace more air than can be removed through the vents, resulting in burning. High clamp tonnage and long-term tool usage can cause parting line and component wear, thus reducing the effective vent depth and preventing gas from escaping.
Flow Lines
Flow lines, or recording, appears as rings or ripples perpendicular to the direction of flow as concentric rings. This occurs when material slides across the mold surface rather than forming a fountain flow and freezing to the mold surface. As more material flows through the mold cavity, it erodes the material off of the mold surface causing this rippled appearance. In general, flow lines result from poor adhesion to the mold surface.
If a low temperature polymer is injected into the mold, it may not adhere properly to the mold surface causing flow lines. A low plastic flow may cause the polymer to cool as it fills the mold, contributing to flow lines. If too little material is injected during 1st stage, the packing pressure may not be high enough to complete mold filling. This causes too much material to be injected during the slower 2nd stage packing resulting in flow lines. A low mold temperature can reduce the adherence of the polymer to the mold surface thus contributing to the creation of flow lines.
Weld and Meld Lines
Weld and meld lines are very similar in appearance because they both result from the joining of two polymer flow fronts. The difference between a weld line and a meld line is how they are formed. Weld lines are created when two flow fronts meet and stop; this is considered a static interaction. Meld lines occur when two flow fronts meet, but continue flowing afterwards; this is considered a dynamic interaction. The dynamic nature of meld lines allows the polymer chains to better interact and entangle.
This generally causes meld lines to have better appearance and strength than weld lines.
Low melt temperature polymers reduce the amount of injection and packing pressure present where the two flow fronts meet, thus causing weak weld and meld lines. Excessive melt temperatures and back pressures can burn and degrade material additives. This degradation creates excessive gasses which can interfere with the molecular entanglement at the point of meld or weld line formation.
A low injection velocity can reduce the strength and appearance of meld and weld lines. However, an excessive injection velocity may cause trapped gas to interfere with molecular chain entanglement at the flow front intersection, causing weak weld and meld lines.
If too little material is injected during 1st stage, the 2nd stage packing pressure may not be high enough to create a proper weld or meld line. Also, gasses trapped in the mold during injection due to blocked vents can interfere with weld and meld line formation. Low 2nd stage packing pressure provides insufficient material to compensate for polymer shrinkage and will result in reduced pressure at the weld or meld line location.
A low mold temperature can reduce the temperature of the polymer at the weld line location, thus reducing the amount of polymer chain entanglement.
Excessive clamp tonnage can compress the mold vents causing gas entrapment which can interfere with proper weld and meld line formation. Remember, inadequate venting will always reduce the strength and appearance of weld and meld lines.
Poor Surface Finish
When the appearance of the part surface looks poor and has inconsistent gloss, it is generally the result of non-uniform adherence of the polymer to the mold surface.
Low melt temperatures cause higher pressure losses in the mold cavity during injection – often resulting in poor surface finish at the end of fill. Excessive melt temperatures and back pressures can cause material degradation, which also affects surface finish. If a low injection velocity is used inconsistently, adherence of the melted polymer to the mold surface near the end of fill may occur.
Too little material injected during 1st stage fill can create a poor part surface finish near the end of fill. Also, low 2nd stage packing pressure provides insufficient material to compensate for polymer shrinkage and causes poor surface finish due to reduced pressure while forcing the polymer into the mold cavity.
A low mold temperature can reduce the temperature of the polymer as it contacts the mold surface. This can cause material to draw away from the mold surface, reducing the part appearance. Excessive clamp tonnage can compress the mold vents and allow gas to be trapped between the mold and the polymer melt. A poor surface finish may also be a result of a mold surface that has become corroded or damaged if it was not kept clean and safe.
Dimensional Defects
Large Dimensions Overall
When part dimensions are larger than expected, it is typically the result of shrinkage being less than anticipated across the entire part.
If a low temperature polymer is injected into the mold, the polymer may solidify prematurely, resulting in reduced polymer shrinkage. If a low injection velocity is being used during injection, the polymer cools as it fills the mold and may cause an increase in cavity pressure resulting in larger part dimensions.
If too much material is injected during 1st stage injection, material will be packed into the mold cavity during 1st stage injection and the part may be larger than expected after packing. High 2nd stage packing pressure may force excessive material into the mold also resulting in larger part dimensions. If the mold temperature is too low the polymer will cool at a faster rate which reduces the shrinkage and increase the overall part dimensions.
Small Dimensions Overall
When the part dimensions are smaller than expected, it is typically the result of insufficient material or excessive shrinkage across the entire part.
If high temperature polymer is injected into the mold, the polymer will solidify slowly which may result in more shrinkage. If a high injection velocity is being used during injection, the polymer will cool less as it fills the mold and may cause a drop in cavity pressure which results in smaller overall part dimensions.
If too little material is injected during 1st stage injection, there may not be sufficient 2nd stage pressure to properly fill and pack the mold and the dimensions will be small. A low 2nd stage packing pressure may not be sufficient to compensate for the part shrinkage as the polymer cools. If the mold temperature is high the polymer will cool at a slower rate and thus will increase shrinkage and decrease the overall part dimensions.
Larger Parts at the Gate
When part dimensions are larger than expected at the gate or smaller near the end of fill, it is generally the result of too much pressure loss across the mold cavity.
Low-temperature polymer causes pressure losses in the cavity to be higher than anticipated, resulting in less pressure being present at the end of fill during both 1st stage filling and 2nd stage packing.
Low injection velocity causes the pressure drop across the mold cavity to increase, resulting in part dimensions being larger at the gate and smaller at the end of fill. Also, if too little material is injected during 1st stage injection, there may not be sufficient 2nd stage pressure to properly fill and pack the end of fill, resulting in smaller dimensions at the end of fill.
Smaller Parts at the Gate
When the part dimensions are either smaller than expected near the gate or larger at the end of fill, it is generally the result of poor gate seal or reduced pressure loss across the mold cavity.
High temperature polymer causes pressure losses in the cavity to be less than anticipated and can result in additional packing pressure reaching the end of fill. Also, if a high plastic flow rate is being used during injection, the pressure drop across the mold cavity will decrease, resulting in higher cavity pressures at the end of fill during both filling and packing. If the 2nd stage time is insufficient, material will flow back through the gate before it seals, resulting in smaller dimensions on the part in the area nearest the gate.
Warpage
Warpage is the result of inconsistent or unexpected dimensions across the molded part resulting in a deformed part. A warped part does not match the shape and form of the mold cavity.
In longer parts, warpage may appear as a twist or bend. This is most often the result of inconsistent stresses in the part, resulting in uneven shrinkage. When investigating this defect, it is often a good practice to measure the part dimensions since they may be large or small overall, at the gate, or at the end of fill. In many cases, correcting for these conditions will improve or eliminate warpage.
If a high temperature polymer is injected into the mold, excessive shrinkage can occur as the material cools. On the other hand, if a low temperature polymer is injected into the mold, large pressure losses can occur and may prevent adequate packing across the entire part. Both of these conditions can result in warpage.
Low injection velocity causes the pressure losses to increase and often results in larger part dimensions near the gate. This variable shrinkage may cause the part to twist or warp. A low 2nd stage packing pressure can result in excessive part shrinkage as the polymer cools causing dimensional instability. Also, high 2nd stage packing pressures can force too much material into the mold, resulting in excessive molded-in stresses. Warpage typically occurs after the part is molded and the internal stresses are relieved. Although some parts may start to relieve this stress immediately, some parts may warp for hours, weeks or even years after being molded.
Insufficient 2nd stage time causes material to flow back through the gate before it seals, resulting in warpage. A high mold temperature causes the polymer to cool at a slower rate. This increases part shrinkage and also causes warpage. High mold temperatures may prevent the material from becoming cool enough to maintain the desired dimensions at the time of part ejection. Although a low mold temperature tends to provide more dimensional stability at the time of part ejection, it can also cool the material too quickly. The rapid part cooling may result in excessive molded-in stresses which may cause part warpage after the part is molded. Molded-in stress relief most often occurs when the part is exposed to heat, stress or a corrosive chemical.
Unevenly distributed cooling lines often cause thick sections to receive the same or less cooling than thin sections, causing warpage. Sharp thickness transitions create sharp shrinkage transitions which contribute to warpage. Sharp corners create stress concentrations which can cause the part to buckle as the part shrinks and warps.
Material Defects
Splay, Bubbles, and Blisters
Splay appears as streaking on the part surface in the direction of flow. Bubbles are small pockets of gas within the part, which are similar in appearance to voids. Bubbles are easiest to detect in translucent parts and can occur in both thin and thick sections. Blisters are small bumps on the surface of the part.
All three defects are caused by moisture, air, gases or volatiles present in the resin or mold surface. They appear most common in hygroscopic materials such as Nylon, polycarbonate, and Acetal.
As a result, improper material handling is the most common cause of all three of these defects. If the material is not properly dried, the moisture will escape the polymer during injection and cause these defects. If a dried material is removed from the dryer and is not used immediately, it can re-absorb moisture from the air. Many contaminants such as fluids, grease, and oils can vaporize in the barrel, resulting in splay, bubbles, and blisters.
Excessive melt temperatures and back pressures can cause material degradation. Sprue break often creates an air bubble in front of the nozzle. This may introduce moisture for highly hygroscopic materials. Excessive screw decompression may draw air into the nozzle and barrel. Any of these conditions may cause splay, bubbles, and blisters.
Brittleness, Cracking, and Crazing
Brittleness is a reduction in the impact resistance of the product. Cracking appear as fractures passing through the part. Cracks are typically located at areas of stress concentration such as corners, ribs, and bosses. Although crazing is similar to cracking, these typically appear as miniature striations on the part surface, but do not pass all the way through the part. Crazing can be located anywhere on the part surface.
Although different in appearance, all three defects have similar origins which contribute to premature part failure. When heated in the barrel, water will hydrolyze, breaking up the molecules into hydrogen and oxygen atoms. These atoms can attack the polymer chains and break them up, resulting in weaker molded parts. Many contaminants such as fluids, grease, oils, and other polymers can interfere with physical properties of the molded part.
Excessive melt temperatures and back pressures can cause material degradation. This degradation can break down the polymer chains and reduce the strength of the molded part. If the plastic flow rate is too high, the polymer may encounter too much shear, causing the polymer chains to break. This results in property loss which can contribute to brittleness, cracking, and crazing.
A low mold temperature may cool the part too quickly, resulting in molded-in stresses. A long cooling time may also cause molded in-stresses which may damage the part during mold opening or ejection.
If the breakaway speed is too fast, the part can become damaged it if sticks to the cavity. The breakaway distance is the distance the mold travels at the reduced breakaway speed. If the part is not properly cleared when breakaway ends and the mold opening speed increases, the part will become damaged. Sharp thickness transitions create stress concentrations due to variations in shrinkage and can cause brittleness, cracking, and crazing.
Delamination
Delamination occurs when the polymer separates into layers as it fills and packs the mold. This condition dramatically affects the intermolecular entanglement and attractions between the polymer layers. Delamination can appear as flaking, large bumps on the part surface, or as split layers at the point of part failure.
In most cases, delamination occurs when the polymer is stressed, degraded, or contaminated. Many contaminants such as water, fluids, grease, oils, and other polymers interfere with physical properties of the molded part, resulting in defects such as delamination.
Very low melt temperatures can cause excessive injection pressures to be used during injection and packing, causing the polymer to separate into layers. Excessively high melt temperatures and back pressures can cause material degradation and delamination.
Contamination
Contamination is the presence of material other than the polymer intended to be processed. Contamination often appears as black or colored specs or streaks in the polymer or on the part surface.
A material can be contaminated by a vartious things such as foreign particles such as dust or dirt, cross contamination from other materials, material originating from either the barrel or inferior regrind.
When processing black or dark colored parts, contamination may be very difficult to see.
Poor housekeeping contributes to an increased presence of dust, contaminants, and particulates in the workplace. Practices such as blowing off equipment with air hoses or brushing off particulates with a broom contributes to the presence of airborne contaminants.
When additives, regrind, and colorants are added, it is important to not expose the additive or base resin to airborne particulates.
Open containers and improperly sealed lids will allow airborne particulates such as dust to contaminate the material. An open lid in a dusty environment, a dirty bucket or scoop, or an unclean material mixer will introduce contaminants to the process. Any leaks or dust present in a material delivery system such as a vacuum loader and centralized delivery system will contaminate the material passing through any material delivery system. Since these systems rely on moving air to transport material from one place to another, dirty or improperly installed filters will also contaminate the material.
The hopper is mounted directly atop the feed throat and can be a difficult component to clean. If your company uses a sliding hopper or a sliding feed throat shut-off, there are often contaminants and dust present in the sliding mechanism which can get into the barrel.
Excessively high melt temperatures and back pressures can cause material degradation. This degradation can affect the appearance of the molded part as well as stick to the screw. Degraded material can stick to the screw flights, nozzle or hot runner system for days, months, or even years before breaking off and contaminating a different batch of material in the future.
Poor Color Distribution
Poor color distribution is inconsistent coloration of the molded part. This is typically the result of poor material mixing, resulting in an uneven distribution of colorants throughout the material.
Improperly mixed colorants will not distribute evenly when melted inside the barrel. As the screw rotates, the polymer chains should have some backflow within the screw flights to ensure the additives are properly mixed. Inadequate back pressure can minimize the backflow and poor color distribution may occur.
Cycling Problems
Part Sticking and Ejector Pin Marks
In some cases, the part may stick to the core or cavity side of the mold. This complicates either mold opening or part ejection. When the resistance to part ejection is too high, the ejector pins can apply too much force to the part surface, resulting in ejector pin marks. Although ‘ejector pin marks’ is a common industry term, any form of ejection such as blades, sleeves, and lifters can cause similar defects. In both part sticking and ejector pin marks, difficulty in removing the part from the core or cavity is most often the cause.
If a low temperature polymer is injected into the mold, it may solidify prematurely, resulting in reduced polymer shrinkage. This most often causes the part to stick to the cavity side of the mold.
If a high temperature polymer is injected into the mold, the polymer may solidify slowly. This can result in increased polymer shrinkage, causing the part to stick to the core.
If too much material is injected during 1st stage injection, material will be packed into the mold cavity during 1st stage. This typically causes the part to stick in the mold during ejection. Low 2nd stage packing pressure can result in excessive part shrinkage, which can cause the part to stick to the core. High 2nd stage packing pressures can force too much material into the mold causing the part to stick to either the core or cavity.
A high mold temperature will cause the polymer to cool at a slower rate, thus increasing part shrinkage and causing part sticking. A low mold temperature may cool the part too quickly, causing molded-in stresses. These stresses often contribute to the presence of ejector pin marks.
A long cooling time may also cause molded in-stresses which may cause the part to become damaged during mold opening or part ejection.
If the two mold halves separate too quickly, the part can stick to the cavity and become damaged. If the part is not properly cleared when the slower mold breakaway speed ends, the part can stick and become damaged. If the part is ejected too fast, it may stick to the core. Parts without draft angles are more likely to stick to the mold. These parts also tend to create vacuum forces which can hold the part to the core or cavity. Many toolmakers polish cores and cavities perpendicular to the direction of mold opening and part removal. This polishing technique may create undercuts which can interfere with the part removal process.
Occasional Part Hang-Up
Occasional part hang-up is when part sticking occurs occasionally, but not consistently.
In multi-cavity molds, a large filling imbalance can cause some filled mold cavities to begin packing while other cavities are short during 1st stage. This situation can cause variable short shots, especially in hot runner molds where cavity filling imbalances are in excess of 6%. The filling imbalances may cause occasional part hang-up.
During mold filling, the gasses present in the mold must escape the mold as the material fills the mold cavity. If gas is trapped in some cavities while other cavities are not blocked, it can cause a significant cavity filling imbalance and occasional part hang-up.
Inadequate cooling will cause the mold to heat up with time. This heating up of the mold can increase the amount of shrinkage that occurs during part cooling causing part sticking. When the part sticks, the process will typically stop as the part is removed. Once this happens, the mold has a short time to cool, often causing the mold to run well until the mold heats up again and hang-ups randomly occur.
Nozzle Freeze-Off
Nozzle freeze-off is when the material in the nozzle cools too much – resulting in a blockage of flow. In most cases, nozzle freeze-off is the result of an improperly heated or insulated nozzle.
Investigate the nozzle heat before investigating the thermocouple placement and poor nozzle heating. In many cases, contact of the nozzle with the sprue bushing can result in a large amount of heat transfer. This situation is only found in cold runner molds since hot runner molds use a heated sprue bushing. This heat transfer is very often reduced through the use of a small piece of insulating material between the nozzle and the sprue bushing.
Specialized insulators made of paper and plastic are available to be placed in front of the nozzle. Some molders use common items, such as business cards, to insulate the nozzle from the mold. You can also install a nozzle with a smaller orifice diameter to minimize the amount of freeze-off that occurs.
If the thermocouple is placed too close to the heater band, it may not accurately represent the temperature of the nozzle. This prematurely heats up the thermocouple which signals the temperature controller to turn off before the nozzle if fully heated. The closer the thermocouple is placed to the melt, the more accurately the temperature of the nozzle is measured and controlled.
Inadequate nozzle heating is typically the result of an inadequately sized heater band. Larger sized nozzles will generally require a larger heater band to maintain the desired temperatures. Larger heater bands may also be required if you are processing a high temperature material such as polysulfone or PEEK.
This will often be identified by the nozzle temperature controller. If the temperature controller remains on more than 50% of the time it is working too hard to maintain the desired temperature. Poor nozzle heating can also be the result of a faulty heater band or controller. If the temperature controller is on nearly 100% of the time, or it cannot reach the desired set point, it may be faulty. Your maintenance department should be capable of determining the condition of your heater bands and temperature controller.
Drool and Stringing
Drool and stringing is defined when material flows out of the nozzle, either onto the machine or into the sprue bushing between cycles. This can also occur in the hot runner system – drooling material into the mold from the gate tip. Stringing is a strand of material pulled out of the nozzle or hot runner tip as the mold opens. This is a result of poor separation between the sprue from the nozzle, or the part from the hot runner gate. Both drool and stringing are the result of excessive pressure at the nozzle or hot runner tip, a low viscosity melt due to a high melt temperature, high nozzle temperature, or material degradation.
Verify the plastic temperature variables are still correct. If necessary, make adjustments to decrease material temperature such as reducing the: screw speed, back pressure, or barrel temperature. Degraded material in the drool or stringing is a good indication of excessive screw speed, back pressure, or barrel temperature.
You can increase the amount of decompression to reduce the pressure at the nozzle. When increasing the decompression, you should ensure you do not retract the screw enough to cause gas to be present in the melt. This may result in splay, bubbles, or blisters on or in the part.
If the nozzle thermocouple is placed too close to the barrel, it may not accurately represent the nozzle temperature. When the thermocouple is placed too close to the barrel it may be measuring the temperature of the barrel and not the nozzle. This can be tested by measuring the temperature of the nozzle using a temperature probe. Whenever checking the nozzle temperature, always ensure that the barrel has been retracted and the material has been purged, and the screw retracted. This ensures there is no pressure present at the nozzle to prevent injury.
If the hot runner tip thermocouple is too close to the mold base, it also may not be accurately reading the hot runner tip temperature. Although this is generally a mold design issue, you can test the performance of the tip by measuring the temperature of the tip using a temperature probe. Again, you should ensure that the nozzle is retracted, the material purged, and screw retracted to ensure there is no pressure present at the hot runner.
Material may flow easily out of a nozzle or tip if the wrong orifice diameter or design is being used. Smaller diameter nozzles can be used to help counteract nozzle drool. Nozzles with a longer orifice length will also reduce the likelihood of nozzle drool. Many injection molders will use a reverse-taper nozzle to help prevent nozzle drool. Reverse-taper nozzles have a diameter which tapers outward to the nozzle tip and helps pull material from the nozzle as the mold opens.
Smaller diameter hot runner tips can often help promote better gate seal to reduce the likelihood of stringing. Some injection molders will use valve gating systems which open and close the tip either mechanically or thermally to prevent stringing or drool. Mechanical valve gates use a pneumatically or hydraulically activated valve gate to physically block material from flowing through the gate. Thermal valve gates use a heating element which heats up quickly to allow material flow, and cools quickly to help prevent material flow.
Troubleshooting Molded Part Defects
The charts below provide a handy reference for troubleshooting molded part defects. Each row represents a different defect, while the columns show different potential causes for that defect.
Columns containing indicate a parameter that may be set too high, while parameters marked with may be set too low. If a column contains , the defect may be caused by settings that are either too low or too high.
The symbol denotes maintenance issues or poorly-designed equipment that may be causing or contributing to the defect.
Troubleshooting Visual Defects
| Screw & Barrel | Filling, Packing & Cooling | Mold & Clamp | |||||||||||||
|---|---|---|---|---|---|---|---|---|---|---|---|---|---|---|---|
| Check Ring | Thermo-couples | Back Pressure | Melt Temp. | 1st Stage Fill | Injection Velocity | Packing Pressure | Hold Time | Mold Temp. | Clamp Tonnage | Platen Deflection | Mold Wear | Blocked Vents | Mold Design | Gate Design | |
| Burning | |||||||||||||||
| Flash | |||||||||||||||
| Flow Lines | |||||||||||||||
| Gate Blush | |||||||||||||||
| Jetting | |||||||||||||||
| Poor Surface Finish | |||||||||||||||
| Short Shot | |||||||||||||||
| Sinks | |||||||||||||||
| Voids | |||||||||||||||
| Weld / Meld Lines | |||||||||||||||
Troubleshooting Dimensional Defects
| Filling, Packing & Cooling | Mold & Clamp | ||||||||
|---|---|---|---|---|---|---|---|---|---|
| Melt Temp. | 1st Stage Fill | Injection Velocity | Packing Pressure | Hold Time | Cooling Time | Mold Temp. | Mold Design | Gate Design | |
| Large at Gate | |||||||||
| Large Overall | |||||||||
| Small at Gate | |||||||||
| Small Overall | |||||||||
| Warpage | |||||||||
Troubleshooting Material Defects
| Material Prep. | Screw & Barrel | Filling, Packing & Cooling | Mold & Clamp | ||||||||||
|---|---|---|---|---|---|---|---|---|---|---|---|---|---|
| Drying Temp. | Drying Time | Contam-ination | Screw Design | Thermo-couples | Back Pressure | Melt Temp. | Injection Velocity | Packing Pressure | Cooling Time | Mold Temp. | Blocked Vents | Mold Design | |
| Blisters | |||||||||||||
| Brittleness | |||||||||||||
| Bubbles | |||||||||||||
| Poor Color Distribution | |||||||||||||
| Contamination | |||||||||||||
| Cracking | |||||||||||||
| Crazing | |||||||||||||
| Delamination | |||||||||||||
| Splay | |||||||||||||
Troubleshooting Cycle-Related Defects
| Material Prep. | Screw & Barrel | Filling, Packing & Cooling | Mold & Clamp | Ejection | ||||||||||||
|---|---|---|---|---|---|---|---|---|---|---|---|---|---|---|---|---|
| Drying Temp. | Drying Time | Contam-ination | Screw Design | Check Ring | Thermo-couples | Back Pressure | Melt Temp. | 1st Stage Fill | Packing Pressure | Cooling Time | Mold Temp. | Blocked Vents | Mold Design | Breakaway Speed | Ejection Speed | |
| Drool / Stringing | ||||||||||||||||
| Ejector Pin Marks | ||||||||||||||||
| Melt Temp. Variation | ||||||||||||||||
| Nozzle Freeze-Off | ||||||||||||||||
| Part Hang-Up | ||||||||||||||||
| Part Sticking | ||||||||||||||||
Purging Materials & Techniques
Purpose of Purging
By definition, to purge is to ‘get rid of.’ In the case of injection molding, purging ensures that contaminants are removed to prepare for a new, contaminant-free application.
Common contaminants include the following:
- Particulates, dirt, and dust
- Paper (from resin bags)
- Cardboard (from boxes)
- Colorants, additives, and reinforcements
- Previously molded resin
- Degraded plastic and carbon buildup
- Flecked plating from the screw and check ring
- Oxidation from the screw, barrel, or check ring
The typical reasons for purging to take place include:
- Color change
- Mold or material change
- Machine shutdown
- Machine startup
- Troubleshooting
- Preventative maintenance
Purging Materials
Resin-Based Purging Compounds
These purging compounds are comprised of a single base material. The resin-based purging compounds most often used are the Final Production Material, Base Material, or Regrind Material.
Resin-based purging operates by the principle that new material will push most of the old material out of the screw and barrel. In practice, this method tends to be very effective in removing a large amount of the material residing in the screw channels due to material conveyance.
Unfortunately, resin-based purging lacks any additives to help remove contaminants that are stuck to the screw flights and check ring. For this reason, more resin-based purging compound is needed when compared to mechanical or chemical purging compounds.
Mechanical Purging Compounds
These purging compounds are comprised of base carrier resin combined with and a tough additive. Although some molders will make their own proprietary compounds, most mechanical purging compounds are purchased with the resin and additive combined. Non-abrasive compounds are available for virtually all molding applications while abrasive purging compounds can damage many molds and equipment.
Mechanical purging compounds operate by the principle that the additive scrubs the screw and barrel while the base resin pushes the material down the barrel. This compound works better than resin-based purging compounds because the scrubbing action of the additive helps to remove stuck material from the screw and barrel.
Chemical Purging Compounds
These purging compounds are comprised of base carrier resin combined with and chemical additive. Some providers sell grades of compound which are pre-mixed and ready to use. Other compound providers sell popular solid and liquid additives which can be added to any of your existing resins. When mixing solid or liquid purging additives, always follow the recommended procedures as well as wear the necessary recommended personal protective equipment. Non-corrosive compounds are available for virtually all molding applications while corrosive purging compounds can damage many molds and equipment.
Most chemical purging compounds operate by the principle that the chemical soaks in the barrel while it expands and breaks down the stuck material. After the manufacturer-recommended period of soak time, the base resin pushes the material down the barrel. Some chemical purging compounds are designed to be left in the barrel for extended periods of time, some must be purged after the designated soak time. Some fast-acting chemicals do not require a soak time, others require a barrel temperature increase, so following the recommended compound-specific purging procedure is very important.
The Four Phases of Purging
Preparation : Involves getting all of your needed materials, tools, equipment, and documentation together before purging takes place. Proper preparation is the most important step in ensuring an efficient and effective purge.
Initial Purge : Involves thoroughly cleaning out the hopper, and then clearing the barrel and screw with a purging compound. You should provide specific procedures to ensure every technician performs this step properly. If this step is performed incorrectly, a large amount of time and purging compound can be wasted.
Final Purge : Includes thoroughly cleaning the hopper again and then filling the barrel and screw with final production material. This is also the step where gate drops are to be removed and cleaned when necessary.
Production : This entails configuring the machine settings for production and then begin molding acceptable parts.
Purging Techniques
Large Shot Purging
This method typically uses 80-100% of the maximum shot size for fewer purge cycles. Large shot purging is popular because it is relatively fast, but it only cycles the check ring a few times.
Small Shot Purging
This method uses a shot size of approximately 10-20% of the machine’s capacity and includes making many small shots of purge. This cycles the check ring many times, which should help clean the check ring more effectively, but may take a little more time than the large shot purging method.
Continuous Purging
This method uses a high back pressure to hold the screw forward and forces the machine behave more like an extruder. This process is typically the fastest method, but does not provide any check ring cycling. This method is typically best for purging hot runner systems and machines without a check ring.
Closed Mold Purging
Specific purging compounds allow parts to be molded while purging takes place. Purge compound is typically molded into parts using settings similar to the documented production settings. This method reduces the safety risk associated with handling, transporting, and storing purge and can be helpful for processes where part quality is strongly affected by production stoppages.
Dry Purging
Dry purging involves pushing out as much material out of the barrel as possible before adding the next material to be processed. This approach often works well for heat-stable materials with very good conveyance properties, but is not recommended for unstable materials since some material will always remain stuck to the screw as the barrel empties.
Wet Purging
Wet purging is performed by leaving the barrel full of the previous material before adding the next material. This method is usually recommended since the screw flights remain full of material. This maintains positive material conveyance in the screw and tends to be useful for materials which have a tendency to stick to the screw.
Basic Mold & Part Design Guidelines
Plastic parts and injection molds require many design considerations to meet the expectations of the consumer. The following plastic part and mold design rules should be taken into consideration when designing either a part or mold.
Uniform Wall Thickness
Design the part with the most uniform nominal wall thickness as possible. This will minimize sinking, warping, residual stresses, material usage, and improve cycle times. Ribs should be placed in areas of stress instead of increasing the wall thickness. By minimizing the wall thickness you will reduce the cycle time, shot weight, and have quicker cooling.
Suggested Wall Thicknesses for Injection Molded Thermoplastic Parts
| minimum | average | maximum | ||||
|---|---|---|---|---|---|---|
| Material | in | mm | in | mm | in | mm |
| Acetal | 0.015 | 0.4 | 0.062 | 1.6 | 0.125 | 3.2 |
| ABS | 0.03 | 0.8 | 0.09 | 2.3 | 0.125 | 3.2 |
| Acrylic | 0.025 | 0.6 | 0.093 | 2.4 | 0.25 | 6.4 |
| Cellulosics | 0.025 | 0.6 | 0.075 | 1.9 | 0.187 | 4.7 |
| FEP | 0.01 | 0.3 | 0.035 | 0.9 | 0.5 | 12.7 |
| Nylon | 0.015 | 0.4 | 0.062 | 1.6 | 0.125 | 3.2 |
| Polycarbonate | 0.04 | 1.0 | 0.093 | 2.4 | 0.375 | 9.5 |
| Polyester T.P | 0.025 | 0.6 | 0.062 | 1.6 | 0.5 | 12.7 |
| Low Density Polyethylene | 0.02 | 0.5 | 0.062 | 1.6 | 0.25 | 6.4 |
| High Density Polyethylene | 0.035 | 0.9 | 0.062 | 1.6 | 0.25 | 6.4 |
| Ethylene Vinyl Acetate | 0.02 | 0.5 | 0.062 | 1.6 | 0.125 | 3.2 |
| Polypropylene | 0.025 | 0.6 | 0.08 | 2.0 | 0.3 | 7.6 |
| Polysulfone | 0.04 | 1.0 | 0.1 | 2.5 | 0.375 | 9.5 |
| PPO (Noryl) | 0.03 | 0.8 | 0.08 | 2.0 | 0.375 | 9.5 |
| Polystyrene | 0.03 | 0.8 | 0.062 | 1.6 | 0.25 | 6.4 |
| Styrene Acrylo Nitrile | 0.03 | 0.8 | 0.062 | 1.6 | 0.25 | 6.4 |
| Polyvinylchloride (Rigid) | 0.04 | 1.0 | 0.093 | 2.4 | 0.375 | 9.5 |
| Polyurethane | 0.025 | 0.6 | 0.5 | 12.7 | 1.5 | 38.1 |
| Ionomer (Surlyn) | 0.025 | 0.6 | 0.062 | 1.6 | 0.75 | 19.1 |
Corner Radii
All corners should have generous radii to avoid excessive stress concentrations. Such stress concentrations can lead to unexpected part failure and should be minimized during all parts of the plastic part production. All features such as bosses, ribs, and shut offs should have generous radii to reduce stress concentrations. To maintain uniform wall thickness and reduce stress concentrations, the use of an inside radius of ½ the nominal wall thickness and an outside radius of 1½ of the nominal wall thickness is recommended.
Ribs and Gussets
These design features should be placed anywhere the part needs increased stiffness. These features will reduce the material consumption, decrease cycle time, as well as increase the structural integrity of the part. Always avoid excessively tall, thick, thin, and sharp cornered features when possible.
Draft Angle
An appropriate draft angle will aide in the removal of the part from the mold. Without the proper draft angle parts may become hung up or stuck upon ejection and mold damage may occur. Be sure there are appropriate draft angles on all bosses, ribs, and nominal walls. The draft angle is most often between 1° and 2° depending on the material and desired surface finish.
Undercuts
Undercuts are mold features that prevent part ejection or mold opening. Undercuts such as clips are commonly added to the part design to simplify post molding operations such as assembly. Unfortunately, the features increase the cost and complexity of the mold because of the additional mechanisms needed to free the part from the mold.
Surface Finish
Most plastic part designs call out a specific surface finish or texture. These features may significantly increase the cost of the tool and should be taken into consideration based upon the application. Highly polished molds require many hours of work to achieve a mirror finish and can be exponentially more expensive than the same tool with a rougher finish. The highest finishes require all lower grades of finishing to be performed before they can be achieved. Textured molds can be very difficult and time consuming to make and may require expensive equipment or a higher degree of skill than polishing.
SPI Surface Finishes
| SPI Finish | Finishing Method | Visual Description | Roughness R.A. |
|---|---|---|---|
| A-1 | Grade #3 Diamond | Mirror/Lens — 420 SS material | 0-1 |
| A-2 | Grade #6 Diamond | Highly Polished | 1-2 |
| A-3 | Grade #15 Diamond | High Polish | 2-3 |
| B-1 | 600 Grit paper | Medium - High Polish | 2-3 |
| B-2 | 400 Grit paper | Medium Polish | 4-5 |
| B-3 | 320 Grit paper | Med – Low Polish | 9-10 |
| C-1 | 600 Stone | Low - Med Polish | 10-12 |
| C-2 | 400 Stone | Low Polish | 25-30 |
| C-3 | 320 Stone | Lower Polish | 35-45 |
| D-1 | Dry Blast Glass Bead | Satin Finish | High/Variable |
| D-2 | Dry Blast #240 Oxide | Dull Finish | High/Variable |
| D-3 | Dry Blast #24 Oxide | Coarse Finish | High/Variable |
Runners
Runner Shapes and Dimensions
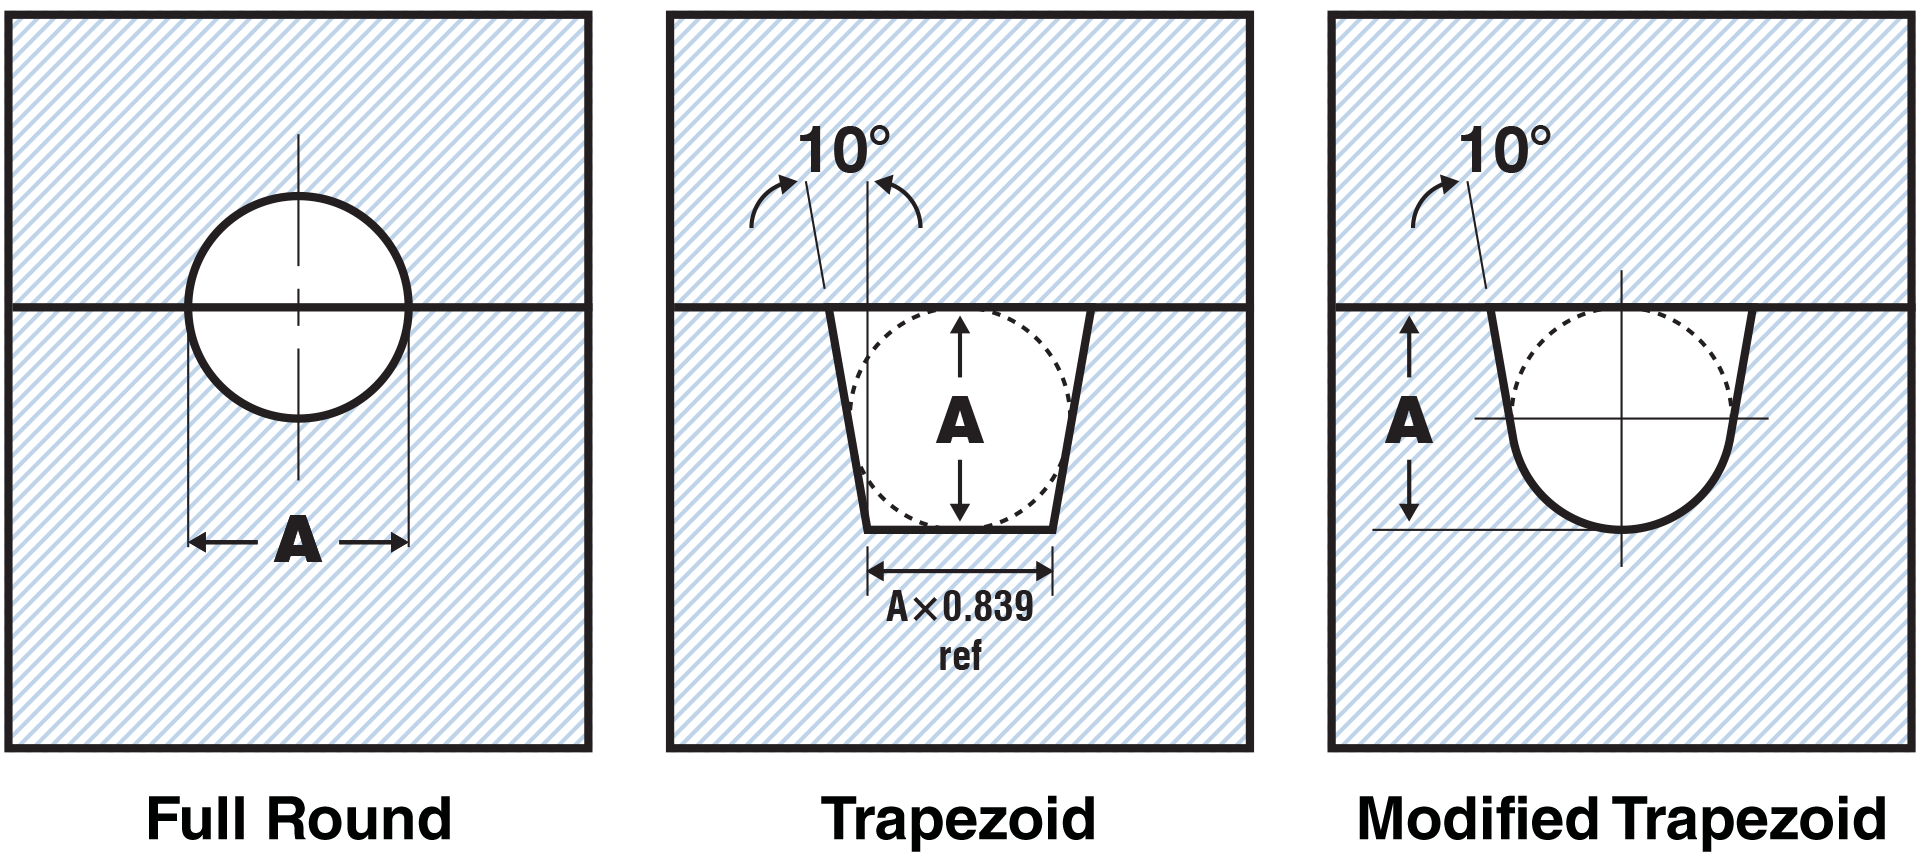
| A | Full Round | Trapezoid | Modified Trapezoid | ||||
|---|---|---|---|---|---|---|---|
| in | mm | in2 | mm2 | in2 | mm2 | in2 | mm2 |
| 1/8 | 3.2 | 0.012 | 8.0 | 0.016 | 10.4 | 0.015 | 9.7 |
| 3/16 | 4.8 | 0.028 | 18.1 | 0.036 | 23.4 | 0.033 | 21.8 |
| 1/4 | 6.4 | 0.049 | 32.2 | 0.063 | 41.6 | 0.059 | 38.7 |
| 5/16 | 7.9 | 0.077 | 49.0 | 0.099 | 63.4 | 0.092 | 59.0 |
| 3/8 | 9.5 | 0.110 | 70.9 | 0.143 | 91.6 | 0.133 | 85.3 |
| 7/16 | 11.1 | 0.150 | 96.8 | 0.194 | 125.1 | 0.181 | 116.4 |
| 1/2 | 12.7 | 0.196 | 126.7 | 0.254 | 163.8 | 0.236 | 152.4 |
| 5/8 | 15.9 | 0.307 | 198.6 | 0.397 | 256.7 | 0.369 | 238.9 |
Suggested Circular Runner Diameters
| minimum | maximum | |||
|---|---|---|---|---|
| Material | in | mm | in | mm |
| ABS | 0.187 | 4.7 | 0.375 | 9.5 |
| Acetal | 0.125 | 3.1 | 0.375 | 9.5 |
| Acrylic | 0.321 | 7.5 | 0.375 | 9.5 |
| Ionomer | 0.093 | 2.3 | 0.375 | 9.5 |
| Nylon | 0.062 | 1.5 | 0.375 | 9.5 |
| Polycarbonate | 0.187 | 4.7 | 0.375 | 9.5 |
| Polyester | 0.187 | 4.7 | 0.375 | 9.5 |
| Polyethylene | 0.062 | 1.5 | 0.375 | 9.5 |
| Polypropylene | 0.187 | 4.7 | 0.375 | 9.5 |
| Polyphenylene Oxide | 0.250 | 6.3 | 0.375 | 9.5 |
| Polysulfone | 0.250 | 6.3 | 0.375 | 9.5 |
| Polystyrene | 0.125 | 3.1 | 0.375 | 9.5 |
| Polyvinylchloride | 0.125 | 3.1 | 0.375 | 9.5 |
| Styrene Acrylonitrile | 0.187 | 4.7 | 0.375 | 9.5 |
Vents
Suggested Vent Depths
| minimum | maximum | |||
|---|---|---|---|---|
| Material | in | mm | in | mm |
| ABS | 0.001 | 0.03 | 0.002 | 0.050 |
| Acetal | 0.0005 | 0.01 | 0.0015 | 0.040 |
| Acrylic | 0.0015 | 0.04 | 0.002 | 0.050 |
| EVA | 0.0005 | 0.01 | 0.0007 | 0.020 |
| HDPE | 0.0008 | 0.02 | 0.001 | 0.025 |
| Ionomer | 0.0005 | 0.01 | 0.0007 | 0.020 |
| LDPE | 0.0005 | 0.01 | 0.0007 | 0.020 |
| Nylon 6/6 | 0.0005 | 0.01 | 0.002 | 0.050 |
| PBT | 0.0005 | 0.01 | 0.0015 | 0.040 |
| PC | 0.001 | 0.03 | 0.003 | 0.075 |
| PC/ABS | 0.0015 | 0.04 | 0.003 | 0.075 |
| PC/SAN | 0.0015 | 0.04 | 0.003 | 0.075 |
| Polyester | 0.0005 | 0.01 | 0.001 | 0.025 |
| PEEK | 0.0005 | 0.01 | 0.0007 | 0.020 |
| PEI | 0.001 | 0.03 | 0.0015 | 0.040 |
| PES | 0.0005 | 0.01 | 0.0007 | 0.020 |
| PP | 0.0005 | 0.01 | 0.002 | 0.050 |
| PPO | 0.001 | 0.03 | 0.002 | 0.050 |
| PPS | 0.0005 | 0.01 | 0.001 | 0.025 |
| PS | 0.001 | 0.03 | 0.002 | 0.050 |
| PSU | 0.001 | 0.03 | 0.0015 | 0.040 |
| PVC (Flexible) | 0.001 | 0.03 | 0.0015 | 0.035 |
| PVC (Rigid) | 0.0015 | 0.04 | 0.002 | 0.050 |
Tool Steels
Tool steels for a particular application are typically chosen based on their hardness, abrasion resistance, machining rate, resistance to deformation at elevated temperatures (red-hardness), and/or chemical resistance. Tool steel is generally heat-treated and annealed to produce the desired properties. The table below is a listing of common tool steels from DME Company LLC used for various structural and holder block applications.
Steels for Structural and Holder Block Applications
| #1 Steel | SAE 1030 Type easy to machine but is not “sticky”, permitting faster and smoother cuts. |
| #2 Steel | AISI 4130 Type pre-heat treated specified for durability and structural applications. High strength steel good for cavity and core retainer plates, clamping plates, and support plates. |
| #3 Steel | P-20 Type pre-heat treated is exceptionally clean and can be heat treated for additional hardness and polished. Good cavity steel. This steel is commonly used for insert molding applications. |
| #5 Steel | Thermal Shock resistant AISI- H-13 type steel annealed for easy machinability and heat treated for hardness. Has good polishability and hardness. Used for die casts and injection molds where hardness and a highly polished surface is necessary. |
| #6 Steel | Modified AISI 420 Stainless supplied fully annealed. Unlike No. 7 Steel this stainless steel is cavity grade and can be subsequently heat treated for a desired hardness, it also has exceptional polishability. |
| #7 Steel | Modified AISI 400 Stainless pre-heat treated for holder block applications. Corrosion resistant with great machinability but cannot be further hardened. |
Common Mold Steels & Important Characteristics
| Steel | Hardness (Rockwell C) |
Thermal Conductivity (BTU/hr/ft°F) |
Description |
|---|---|---|---|
| 1045 | 15-16 | 29 | High strength low cost carbon steel. Poor corrosion and wear resistance but can be nitrided. |
| 4140 | 31-35 | 24.5 | High strength with good fatigue, abrasion, and impact resistance. Common mold base steel. |
| 410 Stainless | 40-45 | 14.4 | Excellent polishability and corrosion resistance with good hardness. Commonly used for highly polished applications such as lenses and optics. |
| 420 Stainless | 54-57 | 14.4 | Excellent polishability & corrosion resistance with good hardness. Commonly used for cavity and core inserts, ejector pins, and ejector sleeves. |
| A6 | 61-62 | 18.5 | Heat-treatable, good wear resistance and toughness. Commonly used for ejection components. |
| D2 | 62-64 | 12.1 | High Carbon/Chromium heat treatable steel with good wear, shock, and abrasion resistance & high toughness. Used for gate blocks, high speed molding, and anything else needing great wear resistance. |
| H13 | 50-54 | 15.5 | Heavily alloyed versatile steel with excellent high temperature and wear resistance & excellent toughness. This steel is commonly used for high-speed machining of cavity and core plates. |
| P20 | 30-32 | 18.5 | Common mold steel with good fatigue abrasion and impact resistance. Typical uses include: mold bases, ejector plates, and larger core and cavity blocks which do not need heat treatment. |
| S7 | 57-60 | 16.5 | Excellent impact resistance, strength, heat transfer, and toughness with low wear resistance. Uses include cavity plates, core plates, laminates, and thin wall sections. |
| A2 | 60-62 | 15 | This steel has good corrosion resistance and excellent wear resistance. Occasionally used for core and cavity blocks where polishing is not required. Most commonly used for high-wear mold components such as lifters and slide blocks. |
| M2 | 63-65 | 12.1 | This high hardness steel has excellent wear resistance which is very difficult to machine. Often used for pre-manufactured components such as ejector pins and ejector sleeves. |
Non-Ferrous Metals
Common Non-Ferrous Injection Mold Metals & Important Characteristics
| Metal | Hardness (Brinell) | Thermal Conductivity (BTU/hr/ft°F) | Description |
|---|---|---|---|
| AL 7075-T6 (Aluminum) | 150 | 75 | High strength and corrosion resistance with good machinability. This aircraft grade aluminum costs more than QC-7 and is used for mold cavities. |
| Al QC-7 (Aluminum) | 167 | 82 | High strength, hardness, and excellent texturing characteristics. Developed for molds and inserts. |
| Cu 940 (Copper) | 210 | 150 | Berrillium-free copper alloy with high strength and thermal conductivity. Used for cooling inserts and shut offs. |
| BeCu (Beryllium Copper) | 371 | 100 | BeCu has excellent fatigue resistance and thermal conductivity. Beryllium copper is used for core and cavity components. |
Basic Heat Treatment
Heat-treating is the act of heating and cooling the steel at predetermined temperatures and times to adjust its’ hardness and strength. Steels that consist of 0.4% carbon or more can be heat-treated.
During the heat-treating process, the chemical structure and dimensions of the steel are changed. As the steel is hardened, it typically increases in size and may cause distortion. The amount of dimensional change is case dependent. For example; an increase in hardness of 20 Rockwell C during heat treatment will result in a more severe change than an increase of 10.
When heated, the steel reaches a specific hardening temperature which transforms it to an austenite state. In the austenite state, the carbon is dispersed within the steel and then must be cooled.
When cooled slowly, or annealed, the steel is changed into a softened state, called pearlite. Annealing involves placing the steel into a medium, such as hot oil, warm air, or salt. This process is used to soften the steel before machining, or to significantly reduce the stresses within the steel after machining.
When the steel is cooled quickly from the austenite state, it changes to a very hard, yet brittle, state called martensite. Hardening is performed in a medium, such as cold oil, air, or water, which quickly removes the heat from the steel.
Tempering involves heating the steel to a temperature slightly below the hardening temperature. In this process the steel slowly cooled to reduce hardness and to increase durability.
As with tempering, stress-relieving involves heating to a temperature slightly below the hardening temperature and then slowly cooling the steel. This reduces stresses within the steel before hardening to help reduce distortion. Stress-relieving is performed after a large amount of steel is removed, or after welding.
Common Surface Treatments
Surface hardening heats the surface of the steel to above the hardening temperature through the use of lasers or electron beams. The surface cools quickly and a hardened layer of steel is formed. As with heat-treating, this procedure can be performed on steels having a carbon content equal to or greater than 0.4%.
Steels that cannot be surface hardened are sometimes carburized. This process heats the steel in the presence of a high-carbon medium, such as leather or charcoal. The carbon-rich surface is then cooled quickly for hardening.
When processing corrosive materials such as PVC and acetals; mold components are often nitrided. This process involves heating the steel in an ammonia-rich environment to incorporate nitrogen into the surface.
Boriding involves surrounding the steel with boron-rich metal plates. The boron migrates to the surface of the steel being treated and creates a thin, yet hard layer of iron boride. This process cannot be used for components having complex geometry, since the steel must come in contact with the boron-rich plates.
Common Surface Coatings
To increase the surface hardness of steel, a layer of titanium carbide or titanium nitride is often added. Titanium carbide is among the hardest coatings available and is applied to prolong the life of high-production cores and cavities. Titanium carbide or titanium nitride coatings are commonly used with abrasive additives, such as glass fibers, talc, and mica.
Nickel or nickel-teflon plating is used to improve the chemical resistance and to reduce the surface friction of the steel. These are commonly used in applications to improve the speed of part removal due to sticking to either the core or cavity.
Adding a layer of chrome to the surface of the steel increases both its’ hardness and its’ chemical resistance. Chrome plating is usually reserved for treating highly polished core and cavity surfaces, or for use with polymers which create residue, such as ABS, PVC and polyethylene.
Wear Considerations
Galling occurs when mold materials of similar hardness wear together though contact. This results in the two mating surfaces balling up and creating large grooves on either side. To prevent galling, mating materials must have a difference of at least 6 Rockwell C hardness.
To help reduce wear on actions, wear plates made of softer materials should be used whenever possible. These should be checked frequently and replaced whenever excessive wear is detected. Brass is commonly used for high wear components since it is easy to machine and will wear away before the harder steel components. Brass plated steel components are even more effective, having the wear characteristics of brass with the increased strength of steel.
Although expensive, graphite impregnated materials should be considered whenever possible. These materials contain graphite inserts imbedded into the metal, which lubricate the surface and provide superior wear resistance.
Porous Metals
Porous metals allow gas to vent through the metal and are available in both porous steel and aluminum. To prevent volatile build up, pressurized air should be forced through the porous metal between each cycle.
Porous metals must be machined using either wire EDM or die sinking EDM machines. Other machining methods, such as milling and grinding, damage the surface by covering the pores. Since porous metals tend to be expensive, they are commonly reserved for small mold cavities, or used as inserts where localized venting is desired.
Units and Conversions
Metric is the most common form of measurement used worldwide and is based on a system of tenths. For example, the Meter is the metric standard for length and one tenth of a meter is a decimeter. One hundredth of a meter is a centimeter, one thousandth of a meter is a millimeter and one thousand meters is a kilometer. The same convention applies to most metric standards: For example, the Gram, Decigram, Centigram, Milligram, and the Liter, Deciliter, Centiliter, and Milliliter.
The imperial system is an older system of measurement that does not use standard conventions. Imperial units include inches, feet, pounds, ounces and gallons. Imperial units are very common in the United States and North America, but less common globally. In the injection molding industry, the inch is the most commonly used imperial unit of measurement for length. Twelve inches equal a foot, three feet equal a yard, and one thousand, seven hundred sixty yards equals a mile.
Imperial units can also become somewhat confusing when dealing with weight and volume measurements. For example, sixteen ounces in weight equals one pound, while one hundred twenty-eight fluid ounces equals a gallon. Since most injection molding facilities operate globally, it is common for personnel to convert measurements from metric units to imperial units, and vice versa, on a regular basis.
Time
Common Time Units
| Abbr. | Unit |
|---|---|
| s | Second |
| min | Minute |
| hr | Hour |
Common Time Conversions
| Equals | |
|---|---|
| 1 min | 60 s |
| 1 hr | 60 min |
Rotation
Common Rotation Units and Terms
| Abbr. | Unit / Term |
|---|---|
| CW | Clockwise |
| CCW | Counterclockwise |
| Rev | Revolution (may be notated as decimal or fraction) |
| ° | Degree |
| rad | Radian |
Common Rotation Conversions
| Equals | |
|---|---|
| 1 Rev | 360° |
| ½ Rev | 180° |
| ¼ Rev | 90° |
| 1° | 0.01745 rad |
| 1 rad | 57.2957° |
Temperature
Common Temperature Units & References
| Standard | Abbr. | Unit | Water Freezes | Water Boils |
|---|---|---|---|---|
| Metric | °C | Degrees Celsius | 0°C | 100°C |
| Imperial | °F | Degrees Fahrenheit | 32°F | 212°F |
Common Temperature Conversions
| °F to °C | (°F - 32) ÷ 1.8 |
| °C to °F | (°C * 1.8) + 32 |
Length
Common Length Units
| Standard | Abbr. | Symbol | Unit |
|---|---|---|---|
| Metric | mm | Millimeters | |
| Metric | cm | Centimeters | |
| Metric | m | Meters | |
| Imperial | in | ” | Inches |
| Imperial | ft | ’ | Feet |
Common Length Conversions
| Convert From: | To: | Multiply By: |
|---|---|---|
| mm | cm | 10 |
| cm | m | 100 |
| cm | mm | 0.1 |
| ft | in | 12 |
| in | ft | 0.0833 |
| in | cm | 2.54 |
| in | mm | 25.4 |
| mm | in | 0.03937 |
| cm | in | 0.3937 |
Speed
Common Speed Units
| Standard | Abbr. | Unit |
|---|---|---|
| Metric | mm/s | Millimeters per second |
| Metric | cm/s | Centimeters per second |
| Imperial | in/s | Inches per second |
| Imperial | ft/s | Feet per second |
Common Speed Conversions
| Convert From: | To: | Multiply By: |
|---|---|---|
| mm/s | in/s | 0.03937 |
| cm/s | in/s | 0.3937 |
| in/s | mm/s | 25.4 |
| in/s | cm/s | 2.54 |
Area
Common Area Units
| Standard | Abbr. | Unit |
|---|---|---|
| Metric | mm² | Square Millimeters |
| Metric | cm² | Square Centimeters |
| Metric | m² | Square Meters |
| Imperial | in² | Square Inches |
| Imperial | ft² | Square feet |
Common Area Conversions
| Convert From: | To: | Multiply By: |
|---|---|---|
| mm² | cm² | 0.01 |
| cm² | mm² | 100 |
| mm² | in² | 0.00155 |
| in² | mm² | 645.146 |
Volume
Common Volume Units
| Standard | Abbr. | Unit |
|---|---|---|
| Metric | mm³ | Cubic Millimeters |
| Metric | cm³ | Cubic Centimeters |
| Metric | m³ | Cubic Meters |
| Metric | l | Liters |
| Metric | ml | Milliliters |
| Imperial | in³ | Cubic Inches |
| Imperial | ft³ | Cubic Feet |
| Imperial | fl oz | Fluid Ounces |
| Imperial | gal | Gallons |
Common Volume Conversions
| Convert From: | To: | Multiply By: |
|---|---|---|
| mm³ | cm³ | 0.001 |
| cm³ | mm³ | 1000 |
| cm³ | in³ | 0.061 |
| in³ | cm³ | 16.387 |
| l | gal | 0.264 |
| gal | l | 3.785 |
| ml | fl oz | 0.0338 |
| fl oz | ml | 29.57 |
Volumetric Flow Rate
Common Volumetric Flow Rate Units
| Standard | Abbr. | Unit |
|---|---|---|
| Metric | mm³/s | Cubic Millimeters per Second |
| Metric | cm³/s | Cubic Centimeters per Second |
| Metric | lpm | Liters per Minute |
| Imperial | in³/s | Cubic Inches per Second |
| Imperial | gpm | Gallons per Minute |
Common Volumetric Flow Rate Conversions
| Convert From: | To: | Multiply By: |
|---|---|---|
| mm³/s | cm³/s | 0.001 |
| cm³/s | mm³/s | 1000 |
| cm³/s | in³/s | 0.061 |
| in³/s | cm³/s | 16.387 |
| lpm | gpm | 0.264 |
| gpm | lpm | 3.785 |
Mass & Force
Common Mass and Force Units
| Standard | Abbr. | Unit |
|---|---|---|
| Metric | mg | Milligrams |
| Metric | g | Grams |
| Metric | kg | Kilograms |
| Imperial | oz | Ounce |
| Imperial | lb | Pound |
Common Mass and Force Conversions
| Convert From: | To: | Multiply By: |
|---|---|---|
| g | mg | 1000 |
| g | kg | 0.001 |
| mg | g | 0.001 |
| kg | g | 1000 |
| lb | oz | 16 |
| oz | lb | 0.0625 |
| g | oz | 0.03527 |
| oz | g | 28.35 |
| kg | lb | 2.2046 |
| lb | kg | 0.4536 |
Mass Flow Rate
Common Mass Flow Rate Units
| Standard | Abbr. | Unit |
|---|---|---|
| Metric | g/hr | Grams per Hour |
| Metric | kg/hr | Kilograms per Hour |
| Imperial | oz/hr | Ounces per Hour |
| Imperial | lb/hr | Pounds per Hour |
Common Mass Flow Rate Conversions
| Convert From: | To: | Multiply By: |
|---|---|---|
| g/hr | kg/hr | 0.001 |
| kg/hr | g/hr | 1000 |
| lb/hr | oz/hr | 16 |
| oz/hr | lb/hr | 0.0625 |
| g/hr | oz/hr | 0.03527 |
| oz/hr | g/hr | 28.35 |
| kg/hr | lb/hr | 2.2046 |
| lb/hr | kg/hr | 0.4536 |
Pressure
Common Pressure Units
| Standard | Abbr. | Unit |
|---|---|---|
| Metric | bar | Bar |
| Metric | MPa | Megapascal |
| Imperial | psi | Pounds per Square Inch |
Common Pressure Conversions
| Convert From: | To: | Multiply By: |
|---|---|---|
| bar | MPa | 0.1 |
| MPa | bar | 10 |
| bar | psi | 14.504 |
| psi | bar | 0.06895 |
| MPa | psi | 145.04 |
| psi | MPa | 0.006895 |
Tonnage
Common Tonnage Conversions
| Convert From: | To: | Multiply By: |
|---|---|---|
| US ton | metric ton | 1.1023 |
| metric ton | US ton | 0.9097 |
| US ton | lb | 2000 |
| lb | US ton | 0.0005 |
| metric ton | kg | 1000 |
| kg | metric ton | 0.0010 |
Common Conversion Calculators
The interactive calculators below provide instant, bi-directional conversions between common Metric and Imperial units for temperature, length, mass, volume, and pressure. Type in a value to be converted, or use the + and − buttons to increase or decrease the value.
Celsius to Fahrenheit (°C to °F)
Millimeters to Inches (mm to in)
Milliliters to Fluid Ounces (ml to fl oz)
Grams To Ounces (g to oz)
bar to psi
Frequently Used Calculations
Intensification Ratio
The intensification ratio is a factor which is used to convert the hydraulic pressure being applied to the hydraulic injection cylinders into the actual pressure being applied to the polymer melt at the front of the screw. Since all-electric molding machines provide the actual plastic pressure, this ratio only relates to hydraulic injection molding machines.
If your injection molding machine provides the actual pressure applied to the plastic, then you should not need the intensification ratio. The following sections explain the three most common methods of calculating the intensification ratio for your machine.

Machine Pressure Graph Method
Many injection molding machines provide a hydraulic pressure vs. plastic pressure graph. This graph allows the molder to take a hydraulic measurement from the machine’s pressure gauge, locate it on the graph on the horizontal axis, follow the value to the graph line and then over to the left to determine its corresponding plastic pressure on the vertical Y axis.

To calculate the intensification ratio, use the graph to locate any hydraulic pressure and its corresponding plastic pressure and then divide the plastic pressure value by the hydraulic pressure.
If there are multiple lines on your pressure graph, it is because your molding machine was offered with multiple screw diameters. To use the correct line, determine which diameter screw your machine has and locate its corresponding pressure curve.
Machine Specifications Method
The specifications for your molding machine can be located either in your machine manual, from other machine-related documentation, or from the manufacturer. The important information you need to obtain is the maximum hydraulic pressure and maximum injection pressure.
To calculate the intensification ratio, divide the injection pressure by the hydraulic pressure.

Hydraulic Cylinder Method
If you know the actual internal dimensions of your hydraulic cylinder you can calculate the exact intensification ratio of your molding machine.
To calculate the intensification ratio, multiply the number of hydraulic cylinders times the internal diameter of the hydraulic cylinder squared and then divide that result by the diameter of the screw squared.

Drying Calculations
Material Consumption
Before determining the dryer residence time, as well as the minimum and maximum dryer size, you must first determine how much material is being used. For the calculations used in this guide, we will refer to material consumption as a measure of material usage per hour. This is typically represented as kilograms or pounds per hour.
To determine the material consumption, you must know the weight of material consumed during each cycle as well as the time used to produce the product. For injection molding, the weight of the entire shot including any parts, sprue, runners, or gates produced is measured. Likewise, the cycle time is provided by the molding machine.
Use the following formula to calculate the material consumption:


Dryer Residence Time
The residence time is the duration the material remains in the material dryer. Residence time is typically provided in hours. To calculate this, you will need to know the dryer capacity (in kilograms or pounds) as well as the material consumption (in kilograms or pounds per hour).
The following formula can be used to calculate the dryer residence time:


Dryer Capacity
The dryer capacity calculation will provide the minimum amount of material the dryer must hold to keep the material dry. Dryer size is typically provided in kilograms or pounds. To calculate this, you will need to know the recommended drying time in hours as well as the material consumption in kilograms or pounds per hour.
Use the following formula to calculate the dryer size:


Part Shrinkage
During the injection molding process, polymer is injected into the mold in the heated state. As the polymer cools, the polymer shrinks away from the mold surface. This results in a part with dimensions as much as 4% smaller than the mold dimensions.
Although molding technicians are rarely involved in calculating the dimensions for the mold steel, they are often asked to provide toolmakers, designers, and quality personnel with the actual shrinkage values from a similar process.
Shrinkage can be represented in one of two ways; as a ratio or as a percentage. When the amount of shrinkage that occurs is represented as a ratio, the inches or millimeters cancel each other out,. As a result, a ratio of .005 in/in equals 0.005 mm/mm. This ratio means that the polymer would shrink 0.005 inch for every inch in mold cavity length. Likewise, the same ratio will imply the part will shrink 0.005 millimeter for every millimeter in mold cavity length.
Likewise, for every millimeter in mold length, the part will shrink 0.005 millimeters. To calculate the shrinkage ratio, you need to know the mold dimensions – as well as the part dimensions.
The part shrinkage equals:

Tolerances
Tolerances are typically expressed as the target value, plus or minus an acceptable tolerance. These can be placed on dimensions such as; distance, angle, diameter, or radius. In some cases, the plus dimension differs from the minus dimension.
Tolerances are typically expressed in a way which can be broken up into two different equations.
| Dimension: | 1.00 ± 0.01 |
| Upper Limit: | 1.00 + 0.01 = 1.01 |
| Lower Limit: | 1.00 - 0.01 = 0.99 |
Chiller Requirements
To determine the correct size chiller you must first determine:
 |
Cooling time | sec |
 |
Total amount of heat to be removed | joule |
 |
Cooling power | joule/sec |
 |
Cooling power per line | watt |
 |
Required volumetric flow rate | m3/sec |
 |
Part Thickness | mm |
 |
Shot weight including cold runners | gram |
 |
Melt temperature | °C |
 |
Polymer temperature at time of ejection | °C |
 |
Expected coolant temperature drop | °C |
 |
Specific heat of the polymer | joule/gram •°C |
 |
Specific heat of the coolant | joule/gram •°C |
 |
Coolant density | kg/m3 |
 |
Number of cooling lines | # |
Cooling Time
The following is the basic way to calculate the part cooling time:

Total Amount of Heat to be Removed
Use the following formula to calculate the total amount of heat to be removed:

Required Cooling Power
The following formula will help to determine the overall amount of cooling power necessary:

Cooling Power Per Line
Use the following formula to determine the amount of cooling power necessary per cooling line:

Required Volumetric Flow Rate
The following formula will help to determine the necessary volumetric flow rate of coolant:
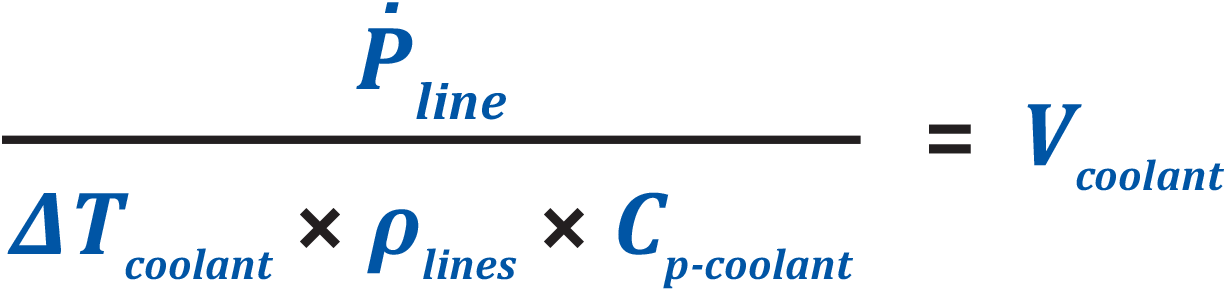
Determining Screw and Barrel Wear
When determining the wear of the screw and barrel, it is important to first measure both the outer diameter (Dscrew) of the screw and the inner diameter (Dbarrel) of the barrel. Once the screw and barrel diameters have been measured, the actual clearance (Cactual) can be calculated using the following calculation:

As a general rule, most molding machines are designed with a radial clearance of the 0.1% of the screw diameter (Dscrew). To calculate the expected clearance (Ddesign) use the following equation:

Once the design clearance and the actual clearance is determined, the wear (W) can be calculated using the following equation:

The acceptable amount of clearance is subject to the application, yet screw manufacturers typically suggest replacement or repair when this wear value reaches 0.05mm to 0.7mm (0.002” to 0.003”) wear for screws with a 5” diameter of less.
Barrel Residence Time
The barrel residence time is the average time the material remains within the barrel either within the flights or in front of the screw. The simplest method of determining this is to add colored pellets at the feedthroat and measure the time it takes for the molded part with the most prominent colorant to appear. The time required for the largest portion of colorant to travel through the barrel is the average residence time.
There are many complex methods of determining barrel residence time, but the method explained below is one of the easier methods:
First, determine the approximate amount of material in the screw flights (Vflights) using the barrel diameter (Dbarrel), barrel length (Dbarrel) and the average root diameter (Droot) of the screw. Many molders will estimate this using the screw diameter at the feed and the screw diameter at the metering section.


Once the volume is determined, the weight (Wflights) of the material in the flights must be determined using the volume of material in the screw flights (Vflights) and the material density (dmaterial).

Once the approximate weight of material in the barrel is determined, you can use the cycle time (tcycle) and the shot weight (Wshot) to estimate the barrel residence time (tresidence).

The Importance of Training
Training is one of the hottest topics among managers throughout the plastics industry. To be competitive in today’s lean global marketplace, companies must produce quality parts with a minimal number of skilled employees.
Machine, tooling, processing, and material technology are constantly changing and training is one of the best ways to prepare your employees. A greater understanding of the job at hand can be achieved through structured training – allowing new employees to become ‘experienced’ much more quickly.
The effort required to set up a structured training program is paid back many times.
Competent workers provide immediate payback through:
- Lower Scrap Rates
- Reduced Mold Damage
- Less Machine Downtime
- Improved Troubleshooting Time
- Faster Machine Startup
- Quicker Changeovers
- Fewer Defects
- More Consistent Part Quality
- Highly Repeatable Processes
- Shorter Cycle Time
- Less Accidents
- Process Optimization
- Extended Tool and Machine Life
- More Energy Efficient Processes
- Increased Customer Satisfaction
- Less Employee Turnover
Annual Savings Per Machine (with a structured in-house training program)
| Injection Molding Machine Hourly Rate | ||||
|---|---|---|---|---|
| Cycle Time Improvement | $30/hr | $40/hr | $50/hr | $60/hr |
| 10% | $18,000 | $25,000 | $31,000 | $37,000 |
| 15% | $28,000 | $37,000 | $47,000 | $56,000 |
| 20% | $37,000 | $50,000 | $62,000 | $75,000 |
| 25% | $46,000 | $62,000 | $78,000 | $93,000 |
| 30% | $56,000 | $75,000 | $93,000 | $112,000 |
| 35% | $65,000 | $87,000 | $109,000 | $131,000 |
Training and the Plastics Industry
A business grows and profits when its employees are constantly increasing their knowledge and experience. No one can dispute that an experienced employee is a valuable asset to any company. But while most managers realize that training is important, many don’t take the time to set up a training initiative and keep it going.
In-house training gives you a competitive edge in today’s fast-paced plastics industry. Trained employees who understand the concepts of the molding process can better adapt to new production runs and can troubleshoot in a more logical and efficient manner. The bottom line: Your company will run smoother and gain a reputation for consistent delivery of quality parts.
Businesses with long term success provide extensive and continuous training for their employees. This attention to education and training is one of the reasons these companies are still competing today. Setting up a comprehensive and flexible in-house training program takes some work but the dividends are well worth it.
Success Factors for Employee Training
Relevant: The information must be relevant to the workplace. An effective training plan instills a good base of fundamental knowledge.
Captivating: In-house training must be able to keep the participants’ attention. Basically, employees cannot learn if they do not pay attention to what is being taught.
Interactive: Interactivity helps employees retain significantly more information. Answering questions, selecting options, receiving feedback, and reviewing materials all contribute to an interactive training environment.
Customizable: The training must be tailored to meet the specific needs of your plant. Online training and focused hands-on training can be easily customized to your facility.
Skill Development: Theoretical information can be helpful but it is critical that employees know how to apply the information. After being trained, the participant needs to develop skills so the knowledge can actually be used in the workplace.
Progress Monitoring: Tracking of results is critical to proving the effectiveness of the training initiative. Facilitators need to use a training method which makes it easy to track, monitor and report on the successes of each employee.
Available Training Options
Training comes in many different forms. We have determined that an effective in-house training initiative requires a combination of different training methods.
Printed Materials
Books, manuals, and industry publications are inexpensive, easy to obtain, and can be used repeatedly. But asking employees to read and retain a large body of written information is unrealistic. Most people require interaction in order to learn effectively. Such materials are essential for reference but do not provide measurable results.
Video Training
Training with videos or DVDs is visually interesting and is somewhat inexpensive, but still lacks interaction and progress monitoring. Furthermore, video is a linear presentation that cannot be customized. Video presentations can be lengthy, and studies have shown that retention drops after more than three minutes of continuous video.
Seminars
There are several questions to ask about classroom training, guest lecturers and seminars. Will the workers be able to understand and keep up with the instructor? How much will they retain if they “zone out” during the session? How many times will they have to repeat the session to apply it on the job? What’s the ideal number of employees to train at one time? The information provided may be useful but it is nearly impossible to track the training’s effectiveness.
Online Training
This form of training is continually gaining popularity throughout every industry. This is most effective when it combines 3D animation, digital video from actual production environments, on-screen titling, and professional narration. This formula is designed to captivate the end user and ensure a higher level of retention. Each training course should contain many questions to test the participant’s knowledge while the program is delivered. This type of training should be available 24/7 to allow employees to learn at their own pace. Such training programs should be up-to-date and use ‘industry best’ practices. Furthermore, courses should be easily customized to your specific needs. Online training provides measurable results and is most effective when used in conjunction with plant-specific exercises. This ensures that the knowledge gained during the interactive training can be demonstrated as learned skills out on the production floor.
On-the-Job Training
Hands-on training is often perceived as the best way to train any employee, but it is very costly. To be successful, such training must be conducted by an experienced supervisor or manager with a knack for instruction. However, the right person for the job is often too busy to train new employees. On-the-job training can teach an employee about the visible workings of machines, but not the inner workings. These are the primary reasons we suggest a structured or “blended” approach.
Structured In-House Training
No single training method can meet each of the success factors necessary to teach all your employees. For this reason, it is important to use a training plan comprised of multiple methods – targeted to teach your employees the knowledge and skills they need to succeed. These training methods should include focused on-the-job instruction, interactive online training, and skill development exercises.
Since it takes many months to reinforce better behaviors, practices, and habits, the most successful initiatives provide training on a weekly basis – and the critical components of the training plan should be repeated each year to ensure the information is retained.
For your training program to be successful, each training session must have clearly defined objectives. Each participant must understand the goal of the training and how it pertains to his/her job. The facilitator must have methods to direct the training and steer the participant from one objective to the next.
Introducing in-house training is just the first step. Effective implementation is then required to significantly increase workforce competence. Your structured training plan ensures that the information is presented in the correct order. This plan dictates the overall flow of the training by establishing a realistic pace which does not overwhelm your employees.
An effective training program also needs the support of management. Employees will follow management’s lead and will develop the same attitude toward training that management has. This is why it’s critical to train from the top down.
Your training plan and materials should be routinely reviewed for accuracy and relevance – and updated whenever practices, equipment, or responsibilities change. Ultimately, your in-house training plan should be comprehensive and flexible in order to constantly develop and improve the skills of your employees.
Training Room Setup
When setting up the training room, it’s important to understand the effect that the room will have on participants. If the room is professionally appointed, clean and quiet, participants will take training seriously. If it’s dirty, cluttered and noisy – with people wandering in and out, the training room will seem more like a break room or cafeteria, and little or no learning will take place.
Choose a room set away from the production area. There should be sufficient lighting, enough chairs and tables for participants to be comfortable, and a small shelf with texts, magazines, manuals and other materials for participant reference. Remove everything from the room that does not pertain directly to training. If this isn’t possible, move boxes or other clutter to a corner of the room and cover it up so it doesn’t distract the participants.
Uphold a few simple rules to distinguish the training area from other areas of the plant. For example, you might insist that no food, drink or smoking be allowed in the training area, and that breaks be taken outside the training room. Make a sign with the rules and post it on the door. This tells participants that the training room is for training only – not for socializing or coffee breaks. The room should be a soft, light color, such as pastel blue or green. Avoid dark colors since these may make employees tired.
Program Implementation
To get the most value from a training program, a custom design and on-site implementation support are essential. Our training designers can visit your plant to create a custom plan for each employee, covering not only major concepts but job-specific tasks to develop and reinforce proper day-to-day work habits as well.
The most effective programs take a blended approach; using online courses in which employees can learn at their own pace and then reinforcing what they learn with routine practice in the plant.
Our successful startup program also includes training on how to track, monitor, and customize your in-house training system.
RightStart™, Routsis Training’s custom implementation process, incorporates all these elements to help you accelerate your training initiatives. For more information, please contact us:
Routsis Training
379 Amherst Street PMB 233
Nashua, NH 03063 (USA)
phone:(978) 957-0700
website:www.traininteractive.com
store:store.traininteractive.com
email: info@traininteractive.com